![[NCEP Logo]](https://webarchive.library.unt.edu/eot2008/20080916171551im_/http://www.nhc.noaa.gov/graphics/ncep.gif)
Text-only version
(printer friendly)
TROPICAL CYCLONE REPORTS
Tropical Storm Allison
Tropical Depression Two
Tropical Storm Barry
Tropical Storm Chantal
Tropical Storm Dean
Hurricane Erin
Hurricane Felix
Hurricane Gabrielle
Tropical Depression Nine
Hurricane Humberto
Hurricane Iris
Tropical Storm Jerry
Hurricane Karen
Tropical Storm Lorenzo
Hurricane Michelle
Hurricane Noel
Hurricane Olga
|
Tropical Cyclone Report
Hurricane Michelle
29 October - 5 November 2001
Jack Beven
National Hurricane Center
23 January 2002
Michelle was a late-season Category 4 hurricane. It was the
strongest hurricane to hit Cuba since 1952, and it left a trail of
death and destruction from Central America to the Bahamas.
a. Synoptic history
The origin of Michelle was a tropical wave that moved westward
across the coast of Africa on 16 October. The wave showed few signs
of development while it crossed the Atlantic to the Lesser Antilles
by 23 October. Associated shower activity increased on 26 October
when the wave reached the western Caribbean, and a broad low
pressure area formed near the coast of Nicaragua the next day. A
gradual increase in organization followed, and an Air Force Reserve
Hurricane Hunter aircraft found that the system had become a
tropical depression near 1800 UTC 29 October over the coast of
Nicaragua, between Puerto Cabezas and Bluefields (Table 1 and
Figure 1).
The depression meandered over eastern Nicaragua for the next 36
hours. A slow north-northeastward motion that began early on the
31st brought the center back over the Caribbean waters
later that day near Cabo Gracias a Dios on the border between
Honduras and Nicaragua. The system became Tropical Storm Michelle
near 0000 UTC 1 November about 50 n mi north of Cabo Gracias.
Michelle moved slowly north-northwestward on the 1st and
steadily strengthened. It became a hurricane on the 2nd
while it drifted slowly northward. Rapid intensification then
occurred, with maximum sustained winds increasing from 70 kt at
1200 UTC on the 2nd to 115 kt at 1200 UTC on the
3rd. The central pressure fell from 988 mb at 0605 UTC
on the 2nd to 937 mb at 1115 UTC on the 3rd
-- a decrease of 51 mb in about 29 hours. Satellite imagery near
the latter time shows a classically-organized hurricane with a
well-defined eye embedded in a central dense overcast surrounded by
outer banding (Figure 2).
Michelle turned slowly north-northeastward after 1200 UTC the
3rd while some fluctuations in intensity occurred. It
reached a peak intensity of 120 kt from 0600-1800 UTC on the
4th while accelerating northeastward. This motion
brought the center of Michelle to the southwestern offshore islands
of Cuba near 1800 UTC that day as a Category 4 hurricane on the
Saffir-Simpson hurricane scale, and to the Cuban mainland near the
Bay of Pigs about 5 hours later.
The eye of Michelle was disrupted by the passage over Cuba and
increasing mid- to upper- level southwesterly flow. This led to the
cyclone gradually losing tropical characteristics on 5 November
while it accelerated northeastward through the Bahamas. The center
moved off the coast of Cuba near 0600 UTC, passed over Andros
Island near 1200 UTC, and over Eleuthera Island near 1800 UTC.
Michelle became a vigorous extratropical cyclone around 0000 UTC on
the 6th, and the center could be followed for another 18
hours before being absorbed into a strong frontal system.
b. Meteorological statistics
Table 1 shows the "best track" positions and intensities for
Michelle, with the track plotted in Figure 1.
Figure 3 and Figure 4
depict the curves of minimum central sea-level pressure and maximum
sustained one-minute average "surface" (10 m above ground level)
winds, respectively, as functions of time. These figures also
contain the data on which the curves are based: aircraft
reconnaissance and dropsonde data from the Air Force Reserve and
NOAA Hurricane Hunters, satellite-based Dvorak technique intensity
estimates from the Tropical Analysis and Forecast Branch (TAFB),
the Satellite Analysis Branch (SAB) of the National Environmental
Satellite Data and Information Service (NESDIS), and the Air Force
Weather Agency, and estimates from surface synoptic data.
The Air Force Reserve Hurricane Hunters made 40
center "fixes" on Michelle, while the NOAA aircraft made 11 fixes
during the time the center was near Cuba. The maximum observed
flight-level winds at 700 mb were 135 kt at 0258 UTC 4 November
about 18 n mi south-southwest of the center. An eyewall dropsonde
near 0408 UTC on the 4th reported 160 kt winds at the
841 mb pressure level. The maximum surface wind reported by land
stations was 108 kt with a gust to 113 kt at Cayo Largo, Cuba at an
unknown time on the 4th. A 113 kt gust was also measured
at Jaguey Grande, Cuba on the 4th.
Abaco Island in the Bahamas reported 63 kt sustained winds at 1500
UTC on the 5th, while Nassau reported a gust to 89
kt. Unofficial observations relayed by amateur radio from
other parts of the Bahamas indicated sustained winds of 70-80 kt.
Sustained winds of tropical-storm force were reported from portions
of the Florida Keys and southeastern Florida. Bermuda also reported
gusts to tropical storm-force winds, but these may have been more
related to the frontal system that absorbed Michelle than to the
storm itself. Additional selected surface observations are included
in Table 2.
The minimum pressure observed by reconnaissance aircraft was 933
mb at 1921 UTC and 2101 UTC 3 November. The latter observation was
accompanied by the lowest observed 700 mb height of 2491 m and is
thus chosen as the time of the overall minimum pressure in
Michelle. The minimum pressure observed by land stations was 949.7 mb
at Cayo Largo on the 4th. Nassau
reported a 983.7 mb pressure at 1500 UTC on the 5th as
the center passed to the south. Puerto Cabezas, Nicaragua reported
a 1004.1 mb pressure at 2100 UTC 30 October as Michelle meandered
over eastern Nicaragua.
A notable aspect of Michelle was that the
aircraft-reported winds and pressures appeared to be somewhat out
of phase. Aircraft-reported winds at the time of the minimum
pressure were roughly 10 kt lower than the previous mission six
hours earlier during rapid intensification. The winds and pressure
then both rose simultaneously over the next 9-12 hours as Michelle
reached peak intensity. This relationship could be partly due to
sampling issues, as no aircraft were in the storm during the last 6
h of the rapid intensification when Michelle showed its best
organization in satellite imagery.
Aircraft 700 mb wind data after Michelle became
extratropical on 6th indicated winds as high as 106 kt.
This would normally support surface winds of 90-95 kt using
reduction factors developed for eyewall conditions (Figure 4).
However, no significant convection was associated with the storm at
that time. Thus, the best track intensity is set to a more
conservative 75 kt using reduction factors for non-convective
situations.
Several ships encountered Michelle, with selected
observations of tropical-storm force or greater winds given in
Table 3. While most of the encounters were well away from the
center, two ships met the core of Michelle. The first was the
Scan Partner, which reported Beaufort force 8/9
winds (34-47 kt) and a 988 mb pressure at 0730 UTC 2 November. The
ship was near the center of Michelle just before the cyclone
reached hurricane strength. The second was from a ship with the
call sign ELWU7 (name unknown) which reported 60
kt winds and a 995.0 mb pressure at 1200 UTC 5 November.
Additionally, a drifting buoy near Cat Island in the Bahamas
reported a 986.7 mb pressure at 1900 UTC on the 5th.
The highest reported storm surge is 9-10 ft (3 m) at
Cayo Largo which reportedly inundated the entire island. Above
normal tides and battering waves 4-5 m high affected other portions
of the coasts of western and central Cuba, causing extensive
coastal flooding. In the Bahamas, storm surges of 5-8 ft were
reported from New Providence Island, while storm surges of unknown
magnitude affected Andros, Eleuthera, Cat Island, Exuma, and Abaco.
Storm surges of 1-3 ft occurred along portions of the southeastern
Florida coast and in the Florida Keys. These surges were part of a
prolonged period of strong onshore winds and high tides that
produced significant beach erosion along portions of the Florida
east coast. Above normal tides and large battering waves also
affected the southern and western shores of the Cayman Islands.
The initial slow movement of Michelle and the
pre-Michelle disturbance caused widespread heavy rains over
portions of Honduras, eastern Nicaragua, northern Costa Rica, and
Jamaica. Ten-day storm totals on Jamaica were as high as 37.44
inches at Comfort Castle, and there are numerous other totals of
over 15 inches (Table 2a). Additional heavy rains occurred over
portions of Cuba, the Bahamas, and the Cayman Islands. Nassau
reported 12.64 inches, while Punta del Este on the Island of Youth
reported 11.83 inches. Outer rain bands also affected Florida,
where rainfall totals were generally 1-3 inches (Table 2).
Two tornadoes were reported in south Florida. An F1
tornado occurred near Belle Glade, while a waterspout moved onshore
at Key Biscayne to become an F0 tornado.
c. Casualty and Damage Statistics
Press reports indicate the death toll from Michelle
stands at 17: 6 in Honduras, 5 in Cuba, 4 in Nicaragua, and 2 in
Jamaica. The deaths in Honduras, Nicaragua, and Jamaica were due to
severe flooding caused by heavy rains. Four of the deaths in Cuba
occurred when a building collapsed during the passage of Michelle,
while the fifth was a coastal drowning under unknown circumstances.
An additional twenty-six people were reported missing in Central
America -- 14 in Honduras and 12 in Nicaragua.
Michelle was the strongest hurricane to hit Cuba
since Hurricane Fox in October 1952. Preliminary reports from the
government of Cuba indicate widespread damage over the central and
western parts of the island, with the provinces of Matanzas, Villa
Clara, and Cienfuegos the hardest hit. Ten thousand homes were
reported destroyed with another 100,000 others damaged. Additional
damage occurred to as yet uncounted businesses and other
structures. Severe damage was also reported to the sugar cane crop
near the path of the storm. No monetary estimates of the damage are
available at this time.
The heavy rains in Honduras and Nicaragua caused
widespread flooding with more than 100,000 people forced from their
homes. The hardest hit area was the province of Gracias a Dios in
the northeastern part of Honduras, where press reports indicate as
many as 100 villages were cut off at one time. The northeastern
part of Nicaragua was also hit by severe floods in and near Puerto
Cabezas. Flooding was also reported in portions of northern Costa
Rica, which casued the evacuation of several thousand people. No
monetary estimate of damages is available at this time.
The flash flooding and mudslides in Jamaica caused
property damage there, although monetary estimates of the amount
are not available at this time. The high surf and tides in the
Cayman Islands caused about $28 million in damage in the Cayman
Islands, primarily along the west coast of Grand Cayman. The two
tornadoes in south Florida were responsible for about $20,000 in
damage.
Additionally, a NOAA P-3 aircraft returned from a
mission into Michelle with damage to the tail section, wings, and
propellers.
d. Forecast and warning critique
Table 4 shows the average track forecast errors during the
tropical storm and hurricane stages of Michelle for the official
NHC track forecast and a selection of objective guidance models.
The NHC average errors were 30 (18 forecasts), 52 (16 forecasts),
75 (14 forecasts), 96 (12 forecasts), and 126 n mi (8 forecasts)
for 12, 24, 36, 48, and 72 h, respectively. These values are 30-40%
below that of the 10-yr (1991-2000) average from 12-48 h and 40-50
% better than the 10-yr average at 72 h. The errors are also about
20-30% lower than those of Climatology-Persistence (CLIPER) at 12
and 24 h and 30-40 % lower at other times -- indicating
considerable skill for this excellent set of forecasts. As good as
the official forecasts were, forecasts from the Aviation run of the
National Weather Service's Medium Range Forecast Model were even
better. None of the average errors of either the model (AVNO) or
the interpolated previous model run (AVNI) exceeded 58 n mi at any
time - a phenomenal set of forecast errors.
Examination of the individual official forecast tracks reveals
that the vast majority correctly forecast the general motion of
Michelle -- a slow northward motion followed by a turn to the
northeast. The largest source of error came from an overestimate of
how far northward Michelle would move before turning northeastward.
Some forecast models showed troubling biases during Michelle -- the
GFDL showed a consistent northwestward bias, while several of the
NOGAPS forecasts moved the storm over the Yucatan Peninsula of
Mexico. These problems contributed to relatively poor track
forecasts errors for those models.
The official intensity forecast errors were 9, 11, 17, 22, and
20 kt at 12, 24, 36, 48, and 72 h respectively. These are near or
somewhat above the 10-yr averages of 7.0, 10.8, 13.7, 16.3, and
19.6 kt for those time periods. The largest intensity forecast
errors occurred due to the rapid intensification of Michelle from
moderate tropical storm to Category 4 hurricane. While the
possibility of rapid intensification was foreseen in the NHC
forecasts and in experimental guidance in the SHIPS model, the
amount was underforecast.
Table 5 shows the watches and warnings
issued for Michelle. The
intensity and relatively predictable motion of Michelle produced
long lead times for watches and warnings in Cuba. Hurricane watches
were issued 51 hours before the center reached the coastal islands
of Cuba, while hurricane warnings were issued 31 hours before the
center arrived. In the Bahamas, hurricane watches were issued 33
hours before the center reached Andros Island, while hurricane
warnings were issued 21 hours before the center arrived. In the
Florida Keys, a tropical storm warning and a hurricane watch were
issued about 42-48 hours before the arrival of the worst
conditions, while a hurricane warning was issued 18-24 hours before
the onset of the worst conditions. Tropical storm warnings were
somewhat short-fused in the Cayman Islands, where they were issued
about 6-12 hours before the closest approach of the center. This
was due mainly to the somewhat earlier than expected northeastward
turn. However, a tropical storm watch was issued
for Grand Cayman Island about 42 hours before the closest approach
of the center.
Acknowledgments
Much of the U.S. data in this report were provided by the local
National Weather Service forecast offices in Key West and Miami,
FL. C-MAN station data were provided by the National Data Buoy
Center. The Meteorological Services of Cuba, the
Bahamas, the Cayman Islands, and Jamaica provided the data for
those countries.
Table 1: Best track for Hurricane Michelle, 29 October - 5 November 2001.
Date/Time
(UTC) | Position | Pressure
(mb) | Wind Speed
(kt) | Stage |
| Lat. (°N) | Lon. (°W) |
| 29 / 1800 | 13.3 | 83.6 | 1004 | 30 | tropical depression |
| 30 / 0000 | 13.7 | 83.6 | 1004 | 30 | " |
| 30 / 0600 | 13.7 | 84.1 | 1005 | 30 | " |
| 30 / 1200 | 13.3 | 83.9 | 1005 | 30 | " |
| 30 / 1800 | 13.0 | 83.5 | 1006 | 30 | " |
| 31 / 0000 | 13.7 | 83.6 | 1004 | 30 | " |
| 31 / 0600 | 14.3 | 83.4 | 1005 | 30 | " |
| 31 / 1200 | 14.8 | 83.2 | 1004 | 30 | " |
| 31 / 1800 | 15.3 | 83.1 | 1004 | 30 | " |
| 01 / 0000 | 15.8 | 83.1 | 1001 | 35 | tropical storm |
| 01 / 0600 | 16.5 | 83.4 | 999 | 45 | " |
| 01 / 1200 | 16.8 | 83.6 | 995 | 50 | " |
| 01 / 1800 | 17.0 | 83.8 | 993 | 50 | " |
| 02 / 0000 | 17.3 | 83.9 | 991 | 55 | " |
| 02 / 0600 | 17.5 | 83.9 | 988 | 60 | " |
| 02 / 1200 | 17.8 | 84.0 | 979 | 70 | hurricane |
| 02 / 1800 | 18.0 | 84.0 | 969 | 80 | " |
| 03 / 0000 | 18.5 | 84.0 | 957 | 90 | " |
| 03 / 0600 | 18.8 | 84.3 | 942 | 105 | " |
| 03 / 1200 | 18.9 | 84.3 | 937 | 115 | " |
| 03 / 1800 | 19.3 | 84.1 | 934 | 110 | " |
| 04 / 0000 | 19.7 | 83.7 | 938 | 115 | " |
| 04 / 0600 | 20.1 | 83.3 | 944 | 120 | " |
| 04 / 1200 | 20.8 | 82.5 | 947 | 120 | " |
| 04 / 1800 | 21.5 | 81.8 | 949 | 120 | " |
| 05 / 0000 | 22.3 | 80.9 | 953 | 105 | " |
| 05 / 0600 | 23.1 | 79.7 | 972 | 80 | " |
| 05 / 1200 | 24.3 | 78.0 | 974 | 80 | " |
| 05 / 1800 | 25.4 | 76.4 | 980 | 75 | " |
| 06 / 0000 | 26.3 | 74.5 | 980 | 75 | extratropical |
| 06 / 0600 | 26.9 | 72.6 | 980 | 75 | " |
| 06 / 1200 | 27.3 | 69.7 | 984 | 65 | " |
| 06 / 1800 | 28.7 | 66.5 | 989 | 55 | " |
| 07 / 0000 | | | | | absorbed by frontal system |
| 03 / 2100 | 19.4 | 83.9 | 933 | 110 | minimum pressure |
| 04/ 1800 | 21.5 | 81.8 | 949 | 120 | Landfall at Cayo Largo, Cuba |
| 04/ 2300 | 22.1 | 81.2 | 950 | 115 | Landfall at Bay of Pigs, Cuba |
| 05/ 1200 | 24.3 | 78.0 | 973 | 80 | Landfall at Andros Island, Bahamas |
| 05/ 1800 | 25.4 | 76.4 | 980 | 75 | Landfall at Eleuthera Island, Bahamas |
Table 2: Hurricane Michelle selected surface observations, 29 October - 5 November 2001.
| | Minimum
Sea-level
Pressure | Maximum Surface Wind Speed
(kt) | |
| Location | Date/
Time
(UTC) | Press.
(mb) | Date/
Timea
(UTC) | Sust.
Windb
(kts) | Peak
Gust (kts) | Storm
Surgec
(ft) | Storm
Tided
(ft) | Rain
(storm total)
(in) |
| Bahamas |
| Abaco | | | 05/1500 | 63 | | | | |
| Eleuthera | | | 05/1500 | 59 | | | | |
| Freeport (MYGF) | | | 05/1300 | 40 | 52 | | | |
| Georgetown | | | 05/1350 | 39 | 51 | | | |
| Lee Stocking Island(NOAA CREWS)f | 05/1600 | 989.8 | 05/1600 | 45 | 54 | | | |
| Marsh Harbor | 05/1800 | 995.6 | | | 72 | | | |
| Nassau (MYNN) | 05/1500 | 983.7 | 05/1800 | 48 | 89 | | | 12.64 |
| New Providence | | | | | | 5-8 | | |
| Cayman Islands |
| Cayman Brac | | | 04/???? | | 35 | | | |
| Grand Cayman | 04/0900 | 1001.3 | 04/1400 | 23 | 38 | | | 6.52 |
| Cuba |
| Aguada de Pasajerosf (78335) | 05/0030 | 958.5 | 04/2300 | 65e | 95 | | | |
| Bainoa (78340) | 04/2045 | 996.1 | 04/2240 | 49e | 76 | | | 3.28 |
| Batabano (78322) | 04/1900 | 995.3 | 04/2310 | 45e | 54 | | | 2.53 |
| Bauta (78376) | 04/2030 | 999.1 | 04/2100 | 49e | 60 | | | 1.59 |
| Camilo Cienfuegos | 05/0510 | 987.4 | 05/0515 | 46 | 63 | | | 4.13 |
| Casablanca (78325) | 04/2110 | 993.4 | 04/2115 | 60e | 72 | | | 1.75 |
| Cayo Largo (MUCL) | 04/???? | 949.7 | 04/???? | 108 | 113 | | 9-10 | |
| Ciego de Avila (MUCA) | | | 04/???? | 27 | 43 | | | |
| Cienfuegos (78344) | 05/0100 | 958.9 | 04/2300 | 65e | 91 | | | |
| Colon (78332) | 04/2300 | 980.9 | 04/1900 | 38e | 79 | | | 3.39 |
| Cuba-Francia (78309) | 04/1656 | 991.7 | 04/1332 | 54e | 71 | | | 4.09g |
| Guines (78323) | 04/2030 | 993.4 | 05/0125 | 44e | 64 | | | 0.93 |
| Guira de Melena (78320) | 04/2055 | 997.7 | 05/0050 | 32e | 56 | | | 3.09 |
| Havana (MUHA) | | | 05/0150 | 36 | 58 | | | |
| Jaguey Grande (78331) | 05/0000 | 992.8 | 04/2100 | 84 | 113 | | | 9.22 |
| Jibaro (78341) | 05/0400 | 995.5 | 05/0415 | 37e | 58 | | | 3.39 |
| Jovellanos (78330) | 05/0000 | 985.3 | 04/2300 | 37e | 54 | | | 6.49 |
| La Fe (78321) | 04/1500 | 991.6 | 04/1900 | 54e | 60 | | | 4.68g |
| Melena del Sur (78375) | 04/2100 | 994.8 | 04/2253 | 43e | 73 | | | 2.39 |
| Nueva Gerona (78221) | 04/1730 | 994.3 | 04/1630 | 50e | 65 | | | |
| Playa Giron (78333) | 04/2300 | 960.5 | 04/1900 | 62 | 105 | | | 5.10 |
| Punta del Este (78324) | 04/1700 | 981.4 | 04/1645 | 69e | 86 | | | 11.83 |
| Sagua La Grande (78338) | 05/0410 | 977.0 | 05/0220 | 49e | 81 | | | 2.24 |
| Sancti Spiritus (78349) | 05/0600 | 990.1 | 05/0430 | 49e | 65 | | | 2.97 |
| Santiago Las Vegas (78373) | 04/2040 | 997.8 | 04/2055 | 49e | 74 | | | 2.27 |
| Santo Domingo (78326) | 05/0300 | 962.8 | 05/0500 | 64e | 85 | | | 2.41 |
| Tapaste (78374) | 04/2050 | 995.5 | 04/2100 | 38e | 65 | | | 3.84 |
| Topes de Collantes (78342) | | | 05/0505 | 54e | 65 | | | 7.60 |
| Trinidad (78337) | 05/0400 | 991.3 | 05/0435 | 38e | 64 | | | 4.78 |
| Union de Reyes (78327) | 05/0000 | 986.6 | 05/0030 | 46e | 81 | | | 4.57 |
| Varadero (78328) | | | 05/0000 | 46e | 81 | | | 3.98 |
| Venezuela (78346) | 05/0650 | 993.0 | 04/1632 | 30 | 52 | | | 1.81 |
| Yabu (78343) | 05/0455 | 963.7 | 05/0300 | 60e | 73 | | | 1.83 |
| Nicaragua |
| Puerto Cabezas | 30/2100 | 1004.1 | | | | | | |
| United States -- Florida |
| Devils Garden | | | | | | | | 1.59 |
| Dry Tortugas SP | | | | | | | | 2.40 |
| Ft. Lauderdale (KFLL) | 05/1200 | 1004.2 | 05/1453 | 29 | 41 | | | 1.27 |
| Hialeah | | | | | | | | 1.51 |
| Key Biscayne | | | | | | | | 1.87 |
| Key West (KEYW) | 05/0701 | 1002.3 | 05/0438 | 32 | 41 | 1.8 | | 2.56 |
| Marathon (KMTH) | 05/0953 | 1001.2 | 05/0153 | 28 | 37 | 1.4 | | 1.79 |
| Miami (KMIA) | 05/0956 | 1003.3 | 05/1529 | 17 | 32 | | | 1.21 |
| Miami Beach | 05/1105 | 1001.2 | 05/0805 | 37 | 44 | | | 1.10 |
| Miami WFO | | | | | | | | 1.59 |
| NW Florida Bay COMPS | 05/0930 | 1000.7 | 05/0900 | 32 | 41 | | | |
| Perrine | | | | | | | | 1.80 |
| Pompano Beach (KPMP) | 05/1100 | 1004.0 | 05/1300 | 24 | 35 | | | 1.18 |
| Tamiami (KTMB) | 05/1000 | 1003.0 | 05/1300 | 17 | 26 | | | 1.37 |
| Tavernier | | | | | | | | 2.73 |
| NOAA C-MAN |
| Dry Tortugas (DRYF1) | 05/0800 | 1005.4 | 04/1810 | 35e | 45 | | | |
| Fowey Rocks (FWYF1) | 05/1000 | 1002.4 | 05/1410 | 46Xe | 53 | | | |
| Lake Worth (LKWF1) | 05/1100 | 1004.3 | 05/1230 | 34e | 42 | | | |
| Long Key (LONF1) | 05/1000 | 1000.7 | 05/1020 | 35e | 43 | | | |
| Molasses Reef (MLRF1) | 05/1200 | 1000.0 | 05/0650 | 41e | 50 | | | |
| Sand Key (SANF1) | 05/0600 | 1001.0 | 05/0500 | 42 | 48 | | | |
| Settlement Point (SPGF1) | 05/2000 | 1002.8 | 05/1310 | 36e | 43 | | | |
| Sombrero Key (SMKF1) | 05/0900 | 1001.4 | 05/0730 | 43e | 50 | | | |
a
Date/time is for sustained wind when both sustained and gust are
listed.
bExcept as noted, sustained wind averaging periods
for C-MAN and U. S. land-based ASOS reports are 2 min; buoy
averaging periods are 8 min. Reports from Cuba are 1
minute averages.
cStorm surge is water height above normal
astronomical tide level.
dStorm tide is water height above National Geodetic
Vertical Datum (1929 mean sea level).
e10-minute average
fStation disabled by storm - incomplete record
g3 November total |
Table 2a: Rainfall data from Jamaica for the period
27 October - 5 November 2001.
| Station | Storm-total Rainfall (in) |
| Jamaica |
| Agulta-Vale | 22.31 |
| Bachelor's Hall | 14.41 |
| Boscobel | 17.19 |
| Bowden | 18.00 |
| Brimmer Hall | 16.93 |
| Brown's Town | 12.25 |
| Castleton Garden | 26.45 |
| Cavaliers | 9.59 |
| Cedar Valley | 21.01 |
| Comfort Castle | 37.44 |
| Constant Spring | 13.01 |
| Discovery Bay | 10.71 |
| Duckenfield | 17.78 |
| Fern Gully | 19.43 |
| Hampstead | 29.11 |
| Hope | 10.67 |
| Industry | 12.91 |
| Irish Town | 12.49 |
| Jacks Hill | 10.02 |
| Kingston (Norman Manley Airport) | 8.20 |
| Laughlands | 17.63 |
| Lawrence Tavern | 10.06 |
| Mavis Bank | 18.61 |
| Middlesex | 20.27 |
| Moore Town | 31.04 |
| Norbrook | 11.03 |
| Orange River | 20.24 |
| Passely Gardens | 15.50 |
| Port Antonio | 6.87 |
| Port Maria | 14.74 |
| Richmond | 21.56 |
| Rowlandsfield | 17.05 |
| Runaway Bay | 15.42 |
| Seaview | 8.57 |
| Spring Garden | 24.66 |
| Stony Hill | 18.70 |
| Walkerswood | 19.78 |
| Waterloo Road | 9.35 |
Table 3: Selected ship and buoy reports from
Hurricane Michelle, 29 October-5 November 2001.
| Ship Name or Call Sign | Date/Time (UTC) | Lat. (°N) | Lon. (°W) | Wind dir/speed (deg/kt) | Pressure (mb) |
| Jo Cedar (PFDI) | 01/1800 | 18.2 | 81.6 | 100/37 | 1007.0 |
| Scan Partner (unknown) | 02/0730 | 17.5 | 84.1 | See Note | 988.0 |
| C6FN5 | 04/0600 | 24.0 | 79.3 | 070/42 | 1006.0 |
| Star Florida (LAVW4) | 04/0900 | 24.2 | 81.5 | 060/37 | 1007.2 |
| Nobel Star (KRPP) | 04/1500 | 24.1 | 83.6 | 050/39 | 1008.0 |
| Emmagracht (PDYX) | 04/1800 | 23.6 | 81.1 | 080/39 | 1003.0 |
| C6QU3 | 04/1800 | 18.0 | 81.1 | 240/34 | 1004.0 |
| ELWU7 | 05/1200 | 25.3 | 75.9 | 050/60 | 995.0 |
| Nedlloyd Van Nes (ELVG7) | 05/1200 | 26.7 | 79.6 | 050/48 | 1003.5 |
| Drifting Buoy 41651 | 05/1900 | 24.3 | 75.4 | N/A | 986.7 |
| ELWX5 | 06/0200 | 20.3 | 68.0 | 190/38 | 1006.9 |
| Washington Senator (DEAZ) | 06/0600 | 29.7 | 77.3 | 020/37 | 1011.8 |
| Liberty Star (WCBP) | 06/0600 | 23.1 | 72.5 | 270/40 | 1003.2 |
NOTE:The ship Scan Partner reported
winds of Beaufort force 8/9, which is 34-47 kt. No direction was
given. |
Table 4: Preliminary track forecast evaluation
for Hurricane Michelle - heterogeneous sample. Errors in nautical
miles for tropical storm and hurricane stages with number of
forecasts in parentheses. Numbers in bold represent forecasts which
were better than the official forecast.
| Forecast Technique | Period (hours) |
| 12 | 24 | 36 | 48 | 72 |
| CLIP | 39 (18) | 80 (16) | 127 (14) | 156 (12) | 183 (8) |
| GFDI | 42 (17) | 94 (15) | 153 (13) | 197 (11) | 237 (7) |
| GFDL* | 49 (18) | 90 (16) | 151 (14) | 195 (12) | 230 (8) |
| LBAR | 39 (18) | 100 (16) | 165 (14) | 230 (12) | 315 (8) |
| VBRI* | 45 (16) | 100 (14) | 160 (12) | 227 (10) | 294 (6) |
| VBAR | 35 (12) | 88 (11) | 150 (9) | 217 (8) | 310 (5) |
| AVNI | 35 (17) | 44 (15) | 58 (13) | 55 (11) | 50 (7) |
| AVNO* | 45 (16) | 46 (14) | 50 (12) | 52 (11) | 48 (8) |
| BAMD | 46 (18) | 83 (16) | 105 (14) | 111 (12) | 163 (8) |
| BAMM | 43 (18) | 77 (16) | 82 (14) | 76 (12) | 95 (8) |
| BAMS | 81 (18) | 155 (16) | 172 (14) | 180 (12) | 220 (8) |
| NGPI | 51 (18) | 106 (16) | 174 (14) | 236 (12) | 397 (8) |
| NGPS* | 42 (9) | 86 (8) | 143 (7) | 205 (6) | 312 (4) |
| UKMI | 40 (15) | 80 (13) | 116 (11) | 154 (10) | 225 (7) |
| UKM* | 43 (9) | 64 (8) | 102 (7) | 131 (6) | 182 (4) |
| A98E | 36 (18) | 67 (16) | 69 (14) | 87 (12) | 172 (8) |
| A9UK | 37 (9) | 72 (8) | 94 (7) | 99 (6) | 176 (4) |
| GUNS | 38 (15) | 77 (13) | 120 (11) | 165 (10) | 253 (7) |
| GUNA | 32 (15) | 59 (13) | 93 (11) | 132 (10) | 196 (7) |
| NHC Official | 30 (18) | 52 (16) | 75 (14) | 96 (12) | 126 (8) |
| NHC Official 10-Year Average (1991-2000) | 44 (2049) | 82 (1835) | 118 (1646) | 151 (1475) | 225 (1187) |
| *Output from these models was unavailable at time of forecast issuance. |
Table 5: Watch and warning summary, Hurricane Michelle, 29 October - 5 November 2001.
| Date/Time | Action | Location |
| 01/2100 | Hurricane watch issued | Western Cuba including the provinces of Pinar Del Rio, La
Habana, Havana City, Matanzas, and the Isle of Youth |
| 02/1700 | Tropical storm watch issued | Grand Cayman Island |
| 02/2100 | Hurricane watch issued | Cuba including the provinces of Villa Clara, Cienfuegos, Sancti
Spiritus, and Ciego de Avila |
| 03/0900 | Tropical storm warning and hurricane watch issued | Florida Keys from Ocean Reef to the Dry Tortugas including
Florida Bay |
| 03/1100 | Hurricane watch upgraded to hurricane warning | Western and Central Cuba including provinces from Pinar Del Rio
to Ciego de Avila and the Isle of Youth |
| 04/0300 | Hurricane watch issued | Northwestern and Central Bahamas including Grand Bahama, the
Abacos, the Berry Islands, Bimini, Andros, New Providence,
Eleuthera, Cat Island, Exumas, San Salvador, Rum Cay, and Long
Island |
| 04/0300 | Tropical storm warning issued | Florida east coast from Jupiter Inlet to Ocean Reef and Florida
west coast south of Bonita Beach |
| 04/0600 | Tropical storm warning issued | Cayman Islands |
| 04/0900 | Hurricane warning issued | Florida Keys from Ocean Reef to the Dry Tortugas including
Florida Bay |
| 04/1500 | Hurricane watch upgraded to hurricane warning | Northwestern and Central Bahamas including Grand Bahama, the
Abacos, the Berry Islands, Bimini, Andros, New Providence,
Eleuthera, Cat Island, Exumas, San Salvador, Rum Cay, and Long
Island |
| 05/0000 | Hurricane watch issued | Bermuda |
| 05/0000 | Tropical storm warning discontinued | Cayman Islands |
| 05/0600 | Hurricane warning downgraded to tropical storm warning | Florida Keys from Ocean Reef to the Dry Tortugas including
Florida Bay |
| 05/0600 | Tropical storm warning discontinued | Florida west coast south of Bonita Beach |
| 05/0900 | Gale warning issued | Florida east coast from Cocoa Beach to Jupiter Inlet |
| 05/1200 | All warnings discontinued | Cuba |
| 05/1200 | Tropical storm warning discontinued | Florida Keys from Craig Key to the Dry Tortugas including
Florida Bay |
| 05/1800 | Tropical storm warning discontinued | Florida east coast from Jupiter Inlet to Craig Key |
| 05/2100 | Hurricane watch changed to tropical storm warning | Bermuda |
| 05/2100 | Gale warning discontinued | Florida east coast from Cocoa Beach to Jupiter Inlet |
| 05/2200 | Hurricane warning changed to tropical storm warning | Abaco and Eleuthera Islands in the Bahamas |
| 05/2200 | Hurricane warning discontinued | Remainder of the Bahamas |
| 06/0300 | Tropical storm warning discontinued | Abaco and Eleuthera Islands in the Bahamas |
| 06/2100 | Tropical storm warning discontinued | Bermuda |
Figure 1:
Best track for Hurricane Michelle, 29 October - 5 November 2001.
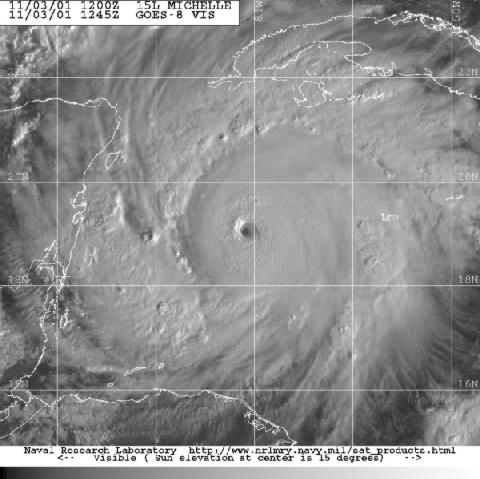
Figure 2:
GOES-8 visible image of Hurricane Michelle at 1245 UTC 3 November. Image
courtesy of the Naval Research Laboratory, Monterey, CA.
Figure 3:
Best track minimum central pressure curve for Hurricane Michelle, 29 October
- 5 November 2001.
Figure 4:
Best track maximum sustained surface wind speed curve for Hurricane
Michelle, 29 October - 5 November 2001, and the observations on which the
best track curve is based. Aircraft observations have been adjusted for
elevation using 90%, 80%, and 80% reduction factors for observations from
700 mb, 850 mb, and 1500 ft, respectively. Dropwindsonde observations
include actual 10 m winds (sfc), as well as surface estimates derived from
the mean wind over the lowest 150 m of the wind sounding (LLM), and from the
sounding boundary layer mean (MBL).
|


