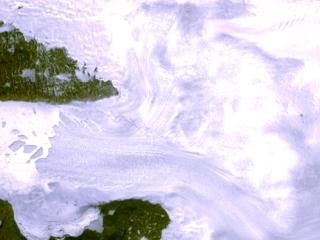
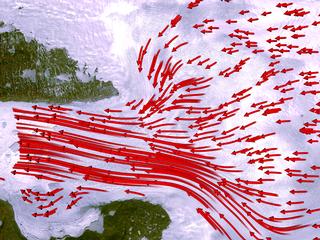
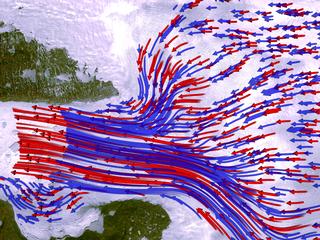
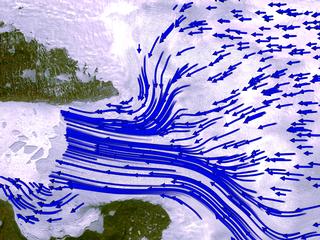
This visualization shows flow directions and relative speeds of the Jakobshavn glacier in Greenland. The red flow lines are from 1992 data; the blue flow lines are 2000 data. Notice that the flow speed of the glacier has increased significantly from 1992 to 2000.
This visualization was created to support a talk at the Fall 2004 AGU meeting.

