 |
|
|
|
|
|
|
|
|
|
|
|
|
|
|
|
|
||||
| ||||||||||
|
|
|
|
Abortion Surveillance -- United States, 1990Lisa M. Koonin, M.N., M.P.H. Jack C. Smith, M.S. Merrell Ramick Division of Reproductive Health, National Center for Chronic Disease Prevention and Health Promotion Abstract Condition: Since 1980, the number of legal induced abortions reported to CDC has remained fairly stable, varying each year by less than or equal to 5%. Reporting Period Covered: This report summarizes and reviews data received by CDC for legal induced abortions obtained in 1990. Description of System: For each year, CDC compiles abortion data received from 52 reporting areas: 50 states, New York City, and the District of Columbia. Results: In 1990, 1,429,577 abortions were reported -- a 2.4% increase from 1989. The abortion ratio for 1990 was 345 legal induced abortions per 1,000 live births, and the abortion rate was 24 per 1,000 women ages 15-44 years. Most women undergoing abortions were young, white, and unmarried; most had had no previous live births and were having the procedure for the first time. Approximately half of all abortions were performed before the 8th week of gestation, and 87% were before the 13th week of gestation. Younger women were more likely to obtain abortions later in pregnancy than were older women. Interpretation: Since 1980, the national number (and rate) of abortions has remained relatively stable, with only small (less than or equal to 5%) year-to-year fluctuations. However, since 1984, the national abortion ratio has declined; in 1990, the abortion ratio was the lowest recorded since 1977. Increasing rates of childbearing may account for some of this decline. Actions Taken: The number and characteristics of women having abortions are needed from all states to furnish an accurate characterization of legal induced abortion in the United States and to assist efforts to identify and reduce preventable causes of morbidity and mortality associated with abortions. INTRODUCTION In 1969, CDC began abortion surveillance to document the number and characteristics of women obtaining legal induced abortions and to assist efforts to identify and reduce preventable causes of morbidity and mortality associated with abortions. This report, as in previous years, is based on abortion data provided to the Division of Reproductive Health (DRH), National Center for Chronic Disease Prevention and Health Promotion, CDC. METHODS For 1990, DRH compiled data received from 52 reporting areas: 50 states, New York City, and the District of Columbia. The total number of legal induced abortions was available from all reporting areas, most of which provided information about the characteristics of women obtaining abortions. For 46 reporting areas, data were provided from the central health agency *; for the remaining six reporting areas, data were provided from hospitals and other medical facilities. Data were reported by the state in which the abortion occurred. Ages of women obtaining legal induced abortions were grouped by 5-year intervals. For the first time in this report, both ratios (the number of abortions per 1,000 live births) and rates (the number of abortions per 1,000 women) are presented by age group. Ratios were calculated by using the number of live births provided by each state's central health agency (except where noted), and rates were calculated by using the number of women recorded in unpublished tabulations provided by the U.S. Bureau of the Census. Rates for women less than 15 years of age were based on those for women ages 10-14 years, and rates for women greater than or equal to 40 years of age were based on those for women ages 40-44 years. Race was categorized either into three groups (white {which includes Hispanics}, black, and all other races) or into two groups (white {which includes Hispanics} and black and other races). For the first time in this yearly report, data on ethnicity are included -- both the number and the abortion ratio for women of Hispanic origin are presented. Because of data collection methods for 1990 abortions, Hispanic origin was not reported separately by race. Race-specific estimates for the number of abortions and for abortion ratios were determined by assuming that Hispanic women were white, since 97% of Hispanic women who had a live birth in 1990 were white (1). In some states with relatively large Hispanic populations, the abortion ratio for white women may reflect to a considerable degree abortions among Hispanic women. Such data analyzed by race may be helpful for public health officials who are responsible for family planning and health education programs. Abortion statistics for 1990 and selected previous years were compared (Table_1). The percentage distributions are based on data from all areas reporting a given characteristic. In contrast to other tables in this report, the summary table excludes all unknown values unless otherwise noted. Abortion ratios and rates are presented by year (Table_2). State-specific characteristics of women obtaining abortions in 1990 are presented (Tables 3-12), and overall tabulations of selected character- istics are given (Tables 13-15). RESULTS In 1990, 1,429,577 legal abortions were reported to CDC -- a 2.4% increase over the number reported for 1989 (2) (Table_1). The national abortion rate increased from 23 abortions per 1,000 women ages 15-44 years in 1986 to 24 per 1,000 in 1987 and has since remained at that rate (Table_2 and Figure_1). The national abortion ratio rose slightly, from 354 abortions per 1,000 live births in 1986 to 356 per 1,000 in 1987, and has declined since then to 345 per 1,000 in 1990. In 1990, as in previous years, the most abortions were performed in California, New York City, and Texas; the fewest were performed in Wyoming, South Dakota, Idaho, and Alaska (2,3) (Table_3). For women whose state of residence was known, approximately 92% had the abortion performed in their own state of residence. The percentage of abortions obtained by out-of-state residents ranged from approximately 53% in the District of Columbia to less than 1% in Hawaii. Eleven reporting areas in 1990 did not have data available for abortions obtained by out-of-state residents. In 1990, 40 states, the District of Columbia, and New York City reported legal abortions by age. Women 20-24 years of age obtained approx- imately 33% of all abortions; women less than 15 years of age obtained about 1% (Table_4). Abortion ratios were highest for the youngest women (844 abortions per 1,000 live births for women less than 15 years of age and 515 per 1,000 live births for women 15-19 years of age) and the oldest women (501 per 1,000 live births for women greater than or equal to 40 years of age); the ratio was lowest for women 30-34 years of age (191 per 1,000 live births) (Figure_2). Among teenagers, the abortion ratio was highest for those less than 15 years of age and lowest for those 19 years of age (Table_5). Abortion rates were highest among women 20-24 years of age (43 abortions per 1,000 women 20-24 years of age) and lowest among women at the age extremes (one abortion per 1,000 women less than 15 years of age and three abortions per 1,000 women greater than or equal to 40 years of age) (Table_4). For most age groups, the abortion ratio rose from 1974 through the early 1980s and declined thereafter, particularly for the youngest and oldest women (i.e., women less than 15 years of age and greater than or equal to 40 years of age) (Figure_3). The abortion ratios for women less than 15 years of age and 15-19 years of age were higher than those for the other age groups. However, 1990 marked the third year in a row for a downward trend among the youngest women. In 1990, the ratio for women less than 15 years of age was the lowest recorded for the time period, and the ratio for women 15-19 years of age was the lowest recorded since 1974. The abortion ratio for women 20-34 years of age (the group with the highest fertility rate) has fluctuated little since 1974 (4). In 1990, approximately 51% of reported legal abortions were performed before 8 weeks of gestation, and about 87% were done before 13 weeks (Table_6). Approximately 4% of the abortions were performed at 16-20 weeks of gestation, and 1% were performed at greater than or equal to 21 weeks. Approximately 97% of legal abortions were performed by curettage, and less than 1% by intrauterine saline or prostaglandin instillation (Table_7). Hysterectomy and hysterotomy were rarely used; less than 0.02% of abortions were performed by these methods. In 1990, 30 states, the District of Columbia, and New York City reported legal abortions by race. As noted in previous reports, almost two thirds of women obtaining abortions were white (2,3) (Table_8). The abortion ratio for black women, however, was about twice that for white women (521 vs. 258 per 1,000 live births). The abortion ratio for women of other minority races was approximately 1.3 times higher (335 per 1,000 live births) than that for white women. In 1990, for the first time, 22 states and New York City reported legal abortions by Hispanic origin (Table_9). The percentage of Hispanic women obtaining abortions in these reporting areas ranged from less than 1% in several states to almost 40% in New Mexico. The abortion ratio for Hispanic women from these reporting areas was 258 per 1,000 live births. When abortion ratios for Hispanic and non-Hispanic white women from the same reporting areas were compared (data not shown), the ratio for Hispanic women was lower (258 per 1,000 live births vs. 267 per 1,000). This pattern was consistent among four of the five areas reporting the largest numbers of Hispanic women obtaining abortions (data not shown). In 1990, approximately 76% of women obtaining abortions were unmarried (Table_10). This percentage varied by state, from about 62% in Utah to almost 85% in Wisconsin. The abortion ratio was approximately 10 times higher for unmarried women than for married women: 879 vs. 89 abortions per 1,000 live births. Approximately 48% of the women obtaining legal abortions had had no previous live births, and about 89% had had two or fewer previous live births (Table_11). The abortion ratio was highest for women who had had no live births and lowest for women who had had one live birth. Approximately 56% of women obtaining abortions were having the procedure for the first time, and approximately 16% had had at least two previous abortions (Table_12). When the age distribution of women undergoing legal abortion was analyzed by race, few differences were found between white women and minority women (Table_13). However, the percentage of minority women less than 15 years of age who obtained an abortion, although small (1.3%), was more than twice that of white women in this age group. When the percentage of women obtaining a legal abortion was analyzed by race and marital status, a slightly higher proportion of unmarried minority women was noted (80.7% of women of black and other races vs. 76.2% of white women). Overall, most women obtained abortions during the first 12 weeks of pregnancy. However, women less than 15 years of age were more likely than older women to obtain abortions later in pregnancy (Table_14). The percentage of women obtaining an early abortion (less than or equal to 8 weeks of gestation) increased with age, and the percentage obtaining a late abortion (greater than or equal to 16 weeks of gestation) decreased with age (Figure_4). Women of black and other races tended to obtain abortions later in pregnancy than did white women (Table_14). More than 99% of abortions at less than or equal to 12 weeks of gestation were performed by curettage (primarily suction procedures) (Table_15). For abortions performed later than 12 weeks of gestation, curettage was also the most common procedure, although it was usually reported as dilatation and evacuation (D&E) (not shown). Most intrauterine instillations involved the use of saline and were usually performed at 16 weeks of gestation or later. DISCUSSION From 1970 through 1982, the reported number of legal abortions in the United States increased every year (Figure_1); the largest percentage increase occurred during 1970-1972. From 1976 through 1982, this annual increase steadily declined, reaching a low of 0.2% for 1980-1981. Since 1980, the number of abortions has remained relatively stable, with only small (less than or equal to 5%) year-to-year fluctuations. The abortion ratio increased steadily from 1970 through 1980, decreased slightly from 1981 through 1983, increased to its highest level in 1984, and then began to decline (Figure_1). In 1990, the national abortion ratio was the lowest recorded since 1977. Increased birth rates for women of all ages may have contributed to this decline (1). The national abortion rate increased each year through 1980, when it reached 25 abortions per 1,000 women ages 15-44 years. Since that time, the rate has remained stable, fluctuating from 23 to 24 abortions per 1,000 women ages 15-44 years (Figure_1). In other countries, legal abortion rates range from a high of more than 100 abortions per 1,000 women of reproductive age (15-44 years) in the former Soviet Union to a low of 5 per 1,000 in the Netherlands (5). The induced abortion rate in the United States is higher than those reported by Australia, Canada, and Western European countries and lower than those reported by the former Soviet Union, China, Cuba, and Eastern European countries (5). Abortion rates for teenagers are higher in the United States than in most Western European countries and in some Eastern European countries (5). Abortion ratios vary widely by age. Although the abortion ratio was highest for teenagers, the percentage of legal abortions they obtained has steadily decreased since the mid-1980s -- from 26% of all legal induced abortions in 1984 to 24% in 1989 and to 22% in 1990 (2). Since 1980, the abortion ratio has declined for most age groups, particularly for the youngest and oldest women. Increasing rates of childbearing among teenagers and women greater than or equal to 35 years old may account for some of the decline in abortion ratios in these age groups (1). In 1990, the abortion ratio for black women continued to be about twice that for white women. Differences in abortion ratios by race may reflect differences in factors such as socioeconomic status, educational level, access to family planning and contraceptive services, and contra- ceptive use. In 1990, the abortion ratio for Hispanic women was lower than for non- Hispanic white women. At all ages, Hispanic women have higher fertility than do non-Hispanic women (1). In contrast to our findings, other studies based on earlier data suggest that abortion rates for Hispanic women were higher than for non-Hispanic women (6). Several other trends -- not necessarily related to each other -- were observed for women who obtained abortions from 1972 through 1990 (Table_1). During that time, the percentage of women obtaining an abortion in their state of residence increased from 56% to 92% and has remained stable at approximately 91%-92% since 1984. From 1972 through 1990, the percentage of women obtaining abortions who were unmarried increased steadily, from 70% to almost 80% in 1984; since then, the percentage has remained about 78%-81% (2). The number of women having abortions who had had one or no previous live births increased from 68% in 1972 to 73% in 1977 and has remained at 74%-78% since that time. The percent distribution of abortions by gestational age has been relatively stable since 1978, although some changes have occurred in the percentage of women obtaining legal abortions either early (less than or equal to 8 weeks) or late (greater than or equal to 16 weeks) in gestation (Table_1). Previous reports have found, as did this study, that age is inversely correlated with the timing of abortion (i.e., younger women were more likely to obtain abortions later in gestation than were older women) (2,7,8). The percentage of women having abortions who did so for the first time decreased from 75% in 1974 to 56% in 1990 (Table_12) (9). During this 15-year period, the percentage of women who had previously had one induced abortion increased from 10% in 1974 to 26% in 1988 and remained at that level in 1990. The percentage who had had two previous abortions increased from about 1% in 1974 to approximately 10% in 1985 and has remained at about 9%-10% since that time. The percentage who had had three or more abortions increased from 0.4% in 1974 to approximately 5% in 1985 and to 6% in 1990. These increases in the early to mid-1980s probably reflected the increasing number of women at risk of having had an abortion and the greater likelihood that women who have had one abortion are more likely to have another abortion when compared with women who have never had one (10,11). During the period 1972-1990, the percentage of abortions performed by curettage increased from 89% to 99% (Table_1). Surveillance during the same period showed a sharp decline in the percentage of abortions performed by intrauterine instillation (from 10% to 1%) and by hysterectomy and hysterotomy (from 0.6% to 0.02%). From 1974 through 1990, the percentage of second-trimester abortions performed by D&E increased from 31% to 93%; the percentage of second- trimester abortions performed by intrauterine instillation decreased from 57% to 5% (9). The increasing use of D&E may have resulted from the improved technology and the lower risk of complications associated with the procedure (12,13). The number of legal abortions reported to CDC in 1990 was probably lower than the number actually performed. Totals provided by central health agencies are often lower than those obtained by direct surveys of abortion providers (14). For example, the total number of abortions reported by CDC for 1988 was approximately 16% lower than that reported for the same year by the Alan Guttmacher Institute, a private organization that directly contacts abortion providers to obtain information on the number of abortions performed ** (15). Despite these limitations, ongoing national surveillance of legal induced abortion is important for several reasons. For example, abortion surveillance is used to identify characteristics of women at high risk of unintended pregnancy. Ongoing surveillance is essential to monitor trends in the number, ratio, and rate of abortions in the United States. Statistics on the number of pregnancies ending in abortion are needed to combine with birth statistics to provide an estimate of pregnancy rates (e.g., pregnancy rates among teenagers {16}) and to calculate other outcome rates (e.g., the rate of ectopic pregnancies per 1,000 pregnancies). In turn, abortion and pregnancy rates can be used to evaluate the effec- tiveness of family planning programs and other programs to prevent unintended pregnancy. Ongoing surveillance also allows an opportunity to assess changes in clinical practice patterns related to abortion (e.g., changes in types of procedure over time). Finally, abortion data are used as denominators to calculate abortion morbidity rates and mortality case-fatality rates. Induced abortions usually are linked to unintended pregnancies, which often occur despite the use of contraception (6,17,18). In the mid-1980s, about 1.2 million live births occurred as a result of unintended pregnancy (i.e., the pregnancy was either mistimed or unwanted at conception) (19). Improving contraceptive practice, as well as access to and education about safe, effective, and low-cost contraception and family planning services, may help minimize the need for abortion in the United States (20). At present, not all states have recognized the need for state-based abortion surveillance, and some states that have recognized the need have been unable to gather information. In the near future, a greater emphasis will likely be placed on preventing unintended pregnancy, particularly among teenagers. To meet this need, the number and characteristics of women obtaining abortions will be needed from all states to furnish an accurate characterization of legal induced abortion in this country. References
* Includes state health departments and the health departments of New York City and the District of Columbia. ** 1988 was the last year in which national abortion survey data were reported by the Alan Guttmacher Institute. Table_1 Note: To print large tables and graphs users may have to change their printer settings to landscape and use a small font size.
TABLE 1. Characteristics of women who obtained legal abortions -- United States, selected years, 1972-1990
========================================================================================================================================================
Characteristic            1972        1973        1976        1980        1985        1986        1987        1988        1989        1990
---------------------------------------------------------------------------------------------------------------------------------------------
Reported number of
  legal abortions         586,760     615,831     988,267   1,297,606   1,328,570   1,328,112   1,353,671   1,371,285   1,396,658   1,429,577

                                                               Percent distribution *
                        ---------------------------------------------------------------------------------------------------------------------
Residence
  In-state                56.2        74.8        90.0        92.6        92.4        92.4        91.7        91.4        91.0        91.8
  Out-of-state            43.8        25.2        10.0         7.4         7.6         7.6         8.3         8.6         9.0         8.2
Age (yrs)
   <=19                   32.6        32.7        32.1        29.2        26.3        25.3        25.8        25.3        24.2        22.4
  20-24                   32.5        32.0        33.3        35.5        34.7        34.0        33.4        32.8        32.6        33.2
   >=25                   34.9        35.3        34.6        35.3        39.0        40.7        40.8        41.9        43.2        44.4
Race
  White                   77.0        72.5        66.6        69.9        66.6        67.0        66.4        64.4        64.2        64.8
  Black and other         23.0        27.5        33.4        30.1        33.4        33.0        33.6        35.6        35.8        35.2
Hispanic origin
  Hispanic                 --          --          --          --          --          --          --          --          --          9.8
  Non-Hispanic             --          --          --          --          --          --          --          --          --         90.2
Marital status
  Married                 29.7        27.4        24.6        23.1        19.3        20.2        20.8        20.3        20.1        21.7
  Unmarried               70.3        72.6        75.4        76.9        80.7        79.8        79.2        79.7        79.9        78.3
Number of live births +
    0                     49.4        48.6        47.7        58.4        56.3        55.1        53.6        52.4        52.2        49.2
    1                     18.2        18.8        20.7        19.4        21.6        22.1        22.8        23.4        23.6        24.4
    2                     13.3        14.2        15.4        13.7        14.5        14.9        15.5        16.0        15.9        16.9
    3                      8.7         8.7         8.3         5.3         5.1         5.3         5.5         5.6         5.7         6.1
  >=4                     10.4         9.7         7.9         3.2         2.5         2.6         2.6         2.6         2.6         3.4
Type of procedure
  Curettage               88.6        88.4        92.8        95.5        97.5        97.0        97.2        98.6        98.8        98.8
    Suction curettage     65.2        74.9        82.6        89.8        94.6        94.5        93.4        95.1        97.1        96.0
    Sharp curettage       23.4        13.5        10.2         5.7         2.9         2.5         3.8         3.5         1.7         2.8
  Intrauterine
    instillation          10.4        10.4         6.0         3.1         1.7         1.4         1.3         1.1         0.9         0.8
  Other &                  1.0         1.2         1.2         1.4         0.8         1.6         1.5         0.3         0.3         0.4
Weeks of gestation
    <=8                   34.0        36.1        47.0        51.7        50.3        51.0        50.4        48.7        49.8        51.6
   9-10                   30.7        29.4        28.1        26.2        26.6        25.8        26.0        26.4        25.8        25.3
  11-12                   17.5        17.9        14.4        12.2        12.5        12.2        12.4        12.7        12.6        11.7
  13-15                    8.4         6.9         4.5         5.1         5.9         6.1         6.2         6.6         6.6         6.4
  16-20                    8.2         8.0         5.1         3.9         3.9         4.1         4.2         4.5         4.2         4.0
   >=21                    1.2         1.7         0.9         0.9         0.8         0.8         0.8         1.1         1.0         1.0
---------------------------------------------------------------------------------------------------------------------------------------------
 * Excludes unknowns. Since the number of states that reported each characteristic varies from year to year, temporal comparisons should be made with
   caution. Percent distributions are based on data from all areas reporting a given characteristic and exclude unknown values unless otherwise noted.
 + For years 1972-1976, data indicate number of living children.
 & Includes hysterotomy and hysterectomy.
-- Not available.
========================================================================================================================================================
Return to top. Table_2 Note: To print large tables and graphs users may have to change their printer settings to landscape and use a small font size.
TABLE 2. Number, ratio, and rate of legal abortions and source of reporting -- United
States, 1970-1990
==============================================================================================
                                                     Number of areas reporting
          Total number                            --------------------------------
            of legal                                  Central          Hospital/
Year       abortions       Ratio *     Rate +     health agency &     facilities @
----------------------------------------------------------------------------------
1970         193,491          52          5             18                 7
1971         485,816         137         11             19                 7
1972         586,760         180         13             21                 8
1973         615,831         196         14             26                26
1974         763,476         242         17             37                15

1975         854,853         272         18             39                13
1976         988,267         312         21             41                11
1977       1,079,430         325         22             46                 6
1978       1,157,776         347         23             48                 4
1979       1,251,921         358         24             47                 5

1980       1,297,606         359         25             47                 5
1981       1,300,760         358         24             46                 6
1982       1,303,980         354         24             46                 6
1983       1,268,987         349         23             46                 6
1984       1,333,521         364         24             44                 8

1985       1,328,570         354         24             44                 8
1986       1,328,112         354         23             43                 9
1987       1,353,671         356         24             45                 7
1988       1,371,285         352         24             45                 7
1989       1,396,658         346         24             45                 7
1990       1,429,577         345 **      24             46                 6
----------------------------------------------------------------------------------
 * Number of abortions per 1,000 live births.
 + Number of abortions per 1,000 women 15-44 years of age.
 & Abortion data reported from central health agency.
 @ Abortion data reported from hospitals and/or other medical facilities in state.
** Differs from the preliminary ratio (344) published in MMWR, vol. 41, no. 50, December 18,
   1992.
==============================================================================================
Return to top. Table_3 Note: To print large tables and graphs users may have to change their printer settings to landscape and use a small font size.
TABLE 3. Reported number, ratio, and rate of legal abortions and percentage of
abortions obtained by out-of-state residents, by state of occurrence -- United States,
1990
==================================================================================================
                         Total number                              Percentage of legal
                           of legal                               abortions obtained by
State                     abortions *     Ratio +     Rate &     out-of-state residents @
-----------------------------------------------------------------------------------------
Alabama                      15,012 **      237        16                   --
Alaska                        1,489 **      125        11                   --
Arizona                      15,783         229        19                   2.5
Arkansas                      5,953         163        11                   3.2
California                  357,579 ++      585        50                   --
Colorado                     12,679         237        16                   8.2
Connecticut                  18,776         375 &&     24                   --
Delaware                      5,557         500        34                   --
District of Columbia         19,969          -- @@     -- ***              52.9
Florida                      66,071         332        24                   --
Georgia                      39,245         349        24                   8.3
Hawaii                        4,748         232        18                   0.8
Idaho                         1,390          85         6                   9.0
Illinois                     67,350         345        25                   --
Indiana                      14,351         167        11                   3.6
Iowa                          7,166 **      182        12                   --
Kansas                        7,516 +++     193 &&     14                  46.5
Kentucky                     10,921         202        13                  29.3
Louisiana                    13,020         181        13                   --
Maine                         4,607         266        16                  12.6
Maryland                     22,425         279 &&     19                   6.8
Massachusetts                39,739         430        27                   3.9
Michigan                     36,183         236        16                   4.2
Minnesota                    17,156         252        17                  10.7
Mississippi                   6,842         157        11                  22.7
Missouri                     16,366         207        14                  10.8
Montana                       3,365         290        19                  23.6
Nebraska                      6,346         260        18                  20.2
Nevada                        7,226         331        26                  11.2
New Hampshire                 4,259 **      243        16                   --
New Jersey                   41,358         337        23                   3.0
New Mexico                    5,288         194        15                   3.9
New York                    159,098         545        37                   3.4
 (City)                     102,202 &&&     787        --                   2.9
 (State)                     56,896         351        --                   4.2
North Carolina               36,494         349        23                   8.3
North Dakota                  1,723         186        12                  38.2
Ohio                         32,165         193        13                   9.7
Oklahoma                     10,708 **      225 &&     15                   --
Oregon                       13,658         319        21                   9.6
Pennsylvania                 52,143         305        19                   5.9
Rhode Island                  7,782         512 &&     33                  21.7
South Carolina               13,285         227        16                   6.1
South Dakota                    946          86         6                  19.4
Tennessee                    21,144         282        18                  17.4
Texas                        92,580         293        23                   3.9
Utah                          4,786         132        12                  15.2
Vermont                       3,184         384        23                  29.8
Virginia                     32,992         334        21                   6.0
Washington                   31,443         397        27                   4.9
West Virginia                 2,500         111         6                  11.7
Wisconsin                    16,848         232        15                   6.1
Wyoming                         363          52         4                  12.4

Total                     1,429,577         345 @@@    24                   8.2
-----------------------------------------------------------------------------------------
  * Abortion data from central health agency unless otherwise noted.
  + Abortions per 1,000 live births (live-birth data from central health agency unless otherwise
    specified).
  & Abortions per 1,000 women ages 15-44 years (number of women ages 15-44 from U.S.
    Department of Commerce, Bureau of the Census, Current Population Survey, March 1990,
    tape technical documentation, Washington, DC).
  @ Based on number of abortions for which residence status of women was known.
 ** Reported from hospitals and/or other medical facilities in state.
 ++ CDC estimate.
 && Live births reported from CDC's National Center for Health Statistics, Advance Report of
    Final Natality Statistics, 1990, vol. 41, no. 9, supplement, February 25, 1993.
 @@ >1,000 Abortions per 1,000 live births.
*** >1,000 Abortions per 1,000 women ages 15-44 years.
+++ Includes 330 Kansas residents obtaining abortions in other states.
&&& Reported by New York City Health Department.
@@@ Differs from the preliminary ratio (344) published in MMWR, vol. 41, no. 50, December 18,
    1992.
 -- Not reported.
==================================================================================================
Return to top. Table_4 Note: To print large tables and graphs users may have to change their printer settings to landscape and use a small font size.
TABLE 4. Reported legal abortions, by age and state of occurrence -- selected states, * United States, 1990
====================================================================================================================================================
                                                                  Age group (yrs)
                  --------------------------------------------------------------------------------------------------------------
                     <15 15-19 20-24 25-29 30-34 35-39>=40       Unknown          Total
                  ----------   ------------   ------------   ------------   ------------   ------------   ---------   ----------    --------------
State               No.   %      No.    %       No.    %       No.    %       No.    %       No.    %     No.    %     No.    %        No.     %
--------------------------------------------------------------------------------------------------------------------------------------------------
Arizona              75  0.5    3,156  20.0    4,869  30.8    3,467  22.0    2,049  13.0    1,015  6.4     229  1.5     923  5.8     15,783  100.0
Arkansas             52  0.9    1,601  26.9    1,995  33.5    1,181  19.8      647  10.9      365  6.1      96  1.6      16  0.3      5,953  100.0
Colorado             62  0.5    3,013  23.8    3,867  30.5    2,646  20.9    1,809  14.3      945  7.5     237  1.9     100  0.8     12,679  100.0
Dist. of Col.       234  1.2    3,467  17.4    6,196  31.0    4,894  24.5    2,893  14.5    1,295  6.5     598  3.0     392  2.0     19,969  100.0
Georgia             461  1.2    8,537  21.8   12,837  32.7    8,731  22.2    5,195  13.2    2,529  6.4     683  1.7     272  0.7     39,245  100.0

Hawaii               42  0.9      937  19.7    1,447  30.5    1,088  22.9      684  14.4      413  8.7     133  2.8       4  0.1      4,748  100.0
Idaho                11  0.8      323  23.2      413  29.7      303  21.8      195  14.0      111  8.0      34  2.4       0  0.0      1,390  100.0
Indiana             114  0.8    3,299  23.0    5,070  35.3    3,037  21.2    1,667  11.6      853  5.9     224  1.6      87  0.6     14,351  100.0
Kansas               61  0.8    2,103  29.3    2,328  32.4    1,346  18.7      790  11.0      426  5.9     124  1.7       8  0.1      7,186  100.0
Kentucky +          197  1.8    3,218  29.5    3,545  32.5    1,964  18.0    1,150  10.5      614  5.6     177  1.6      56  0.5     10,921  100.0

Louisiana           150  1.2    2,934  22.5    4,287  32.9    2,716  20.9    1,670  12.8      938  7.2     281  2.2      44  0.3     13,020  100.0
Maine                23  0.5    1,091  23.7    1,563  33.9      981  21.3      568  12.3      275  6.0      83  1.8      23  0.5      4,607  100.0
Maryland            214  1.0    4,808  21.4    7,599  33.9    5,199  23.2    2,900  12.9    1,380  6.2     325  1.4       0  0.0     22,425  100.0
Massachusetts       216  0.5    7,401  18.6   13,137  33.1    9,611  24.2    5,517  13.9    2,899  7.3     760  1.9     198  0.5     39,739  100.0
Michigan            310  0.9    8,986  24.8   11,892  32.9    7,484  20.7    4,576  12.6    2,313  6.4     564  1.6      58  0.2     36,183  100.0

Minnesota            74  0.4    3,756  21.9    5,860  34.2    3,734  21.8    2,146  12.5    1,138  6.6     295  1.7     153  0.9     17,156  100.0
Mississippi         119  1.7    1,847  27.0    2,207  32.3    1,311  19.2      797  11.6      414  6.1     133  1.9      14  0.2      6,842  100.0
Missouri            152  0.9    3,528  21.6    5,498  33.6    3,594  22.0    2,213  13.5    1,121  6.8     257  1.6       3  0.0     16,366  100.0
Montana              21  0.6      914  27.2      981  29.2      666  19.8      458  13.6      245  7.3      78  2.3       2  0.1      3,365  100.0
Nebraska             41  0.6    1,772  27.9    2,102  33.1    1,199  18.9      738  11.6      377  5.9     112  1.8       5  0.1      6,346  100.0

Nevada               25  0.3    1,239  17.1    2,213  30.6    1,847  25.6    1,139  15.8      578  8.0     150  2.1      35  0.5      7,226  100.0
New Jersey          313  0.8    8,635  20.9   14,246  34.4    9,537  23.1    5,340  12.9    2,497  6.0     756  1.8      34  0.1     41,358  100.0
New Mexico           49  0.9    1,240  23.4    1,609  30.4    1,089  20.6      730  13.8      405  7.7     142  2.7      24  0.5      5,288  100.0
New York          1,102  0.7   29,729  18.7   50,399  31.7   38,070  23.9   23,132  14.5   11,561  7.3   3,282  2.1   1,823  1.1    159,098  100.0
 (City)             766  0.7   16,787  16.4   31,173  30.5   25,934  25.4   16,122  15.8    7,906  7.7   2,202  2.2   1,312  1.3    102,202  100.0
 (State)            336  0.6   12,942  22.7   19,226  33.8   12,136  21.3    7,010  12.3    3,655  6.4   1,080  1.9     511  0.9     56,896  100.0

N. Carolina         398  1.1    9,327  25.6   12,555  34.4    7,158  19.6    3,945  10.8    2,017  5.5     521  1.4     573  1.6     36,494  100.0
N. Dakota             3  0.2      472  27.4      578  33.5      338  19.6      171   9.9      119  6.9      42  2.4       0  0.0      1,723  100.0
Ohio                130  0.4    6,018  18.7   10,569  32.9    6,445  20.0    3,882  12.1    1,940  6.0     631  2.0   2,550  7.9     32,165  100.0
Oregon               75  0.5    3,192  23.4    4,407  32.3    2,830  20.7    1,765  12.9      973  7.1     288  2.1     128  0.9     13,658  100.0
Pennsylvania        484  0.9   12,052  23.1   17,556  33.7   10,824  20.8    6,822  13.1    3,503  6.7     902  1.7       0  0.0     52,143  100.0

Rhode Island         50  0.6    1,560  20.0    2,760  35.5    1,643  21.1    1,086  14.0      540  6.9     130  1.7      13  0.2      7,782  100.0
S. Carolina         120  0.9    3,222  24.3    4,565  34.4    2,862  21.5    1,619  12.2      725  5.5     171  1.3       1  0.0     13,285  100.0
S. Dakota             7  0.7      253  26.7      295  31.2      169  17.9      128  13.5       72  7.6      22  2.3       0  0.0        946  100.0
Tennessee           226  1.1    5,273  24.9    7,011  33.2    4,354  20.6    2,584  12.2    1,348  6.4     345  1.6       3  0.0     21,144  100.0
Texas               472  0.5   17,543  18.9   31,190  33.7   21,735  23.5   13,092  14.1    6,377  6.9   1,962  2.1     209  0.2     92,580  100.0

Utah                 37  0.8    1,105  23.1    1,589  33.2    1,027  21.5      620  13.0      295  6.2      88  1.8      25  0.5      4,786  100.0
Vermont              14  0.4      785  24.7    1,025  32.2      669  21.0      373  11.7      243  7.6      74  2.3       1  0.0      3,184  100.0
Virginia            238  0.7    7,192  21.8   10,912  33.1    7,331  22.2    4,424  13.4    2,226  6.7     559  1.7     110  0.3     32,992  100.0
Washington          174  0.6    6,675  21.2   10,117  32.2    7,136  22.7    4,456  14.2    2,221  7.1     650  2.1      14  0.0     31,443  100.0
W. Virginia          21  0.8      696  27.8      831  33.2      476  19.0      260  10.4      169  6.8      44  1.8       3  0.1      2,500  100.0

Wisconsin           139  0.8    4,106  24.4    5,893  35.0    3,426  20.3    2,028  12.0      983  5.8     267  1.6       6  0.0     16,848  100.0
Wyoming               3  0.8       99  27.3      127  35.0       64  17.6       42  11.6       21  5.8       7  1.9       0  0.0        363  100.0

Total             6,709  0.8  187,104  21.4  288,140  32.9  194,182  22.2  116,300  13.3   58,479  6.7  16,456  1.9   7,910  0.9    875,280  100.0

Abortion ratio &    844           515            377            220            191            273          501                          302
Abortion rate @       1            30             43             26             15              8            3                           18
--------------------------------------------------------------------------------------------------------------------------------------------------
* All 40 states for which data are available, the District of Columbia, and New York City.
+ Redistributed based on known distribution for 6 months of data.
& Calculated as the number of legal abortions obtained by women in a given age group per 1,000 live births to women in the same age
  group for these states. For each state, abortions obtained by women of unknown age are distributed according to the known age
  distribution for that state. Excludes states reporting age unknown for >15% of women having abortions.
@ Calculated as the number of legal abortions obtained by women in a given age group per 1,000 women in the same age group for these
  states. For each state, abortions obtained by women of unknown age are distributed according to the known age distribution for that
  state. Excludes states reporting age unknown for >15% of women having abortions.
====================================================================================================================================================
Return to top. Table_5 Note: To print large tables and graphs users may have to change their printer settings to landscape and use a small font size.
TABLE 5. Reported legal abortions obtained by teenagers, by age and state of occurrence -- selected states, * United States,
1990
=========================================================================================================================================
                                                    Age (yrs)
                  --------------------------------------------------------------------------------
                     <15           15           16            17            18             19            Total
                  ----------   ----------   -----------   -----------   -----------   ------------   -------------
State               No.   %      No.   %     No.    %      No.    %      No.    %       No.    %       No.     %
------------------------------------------------------------------------------------------------------------------
Arizona              75  2.3     204  6.3     355  11.0     524  16.2     969  30.0    1,104  34.2    3,231  100.0
Arkansas             52  3.1      93  5.6     173  10.5     242  14.6     583  35.3      510  30.9    1,653  100.0
Colorado             62  2.0     208  6.8     398  12.9     676  22.0     835  27.2      896  29.1    3,075  100.0
Georgia             461  5.1     643  7.1   1,078  12.0   1,654  18.4   2,376  26.4    2,786  31.0    8,998  100.0
Hawaii               42  4.3      91  9.3     137  14.0     196  20.0     238  24.3      275  28.1      979  100.0

Idaho                11  3.3      21  6.3      45  13.5      58  17.4      95  28.4      104  31.1      334  100.0
Indiana             114  3.3     231  6.8     333   9.8     447  13.1   1,041  30.5    1,247  36.5    3,413  100.0
Kansas               61  2.8     164  7.6     337  15.6     430  19.8     560  25.9      612  28.3    2,164  100.0
Kentucky +          197  5.8     231  6.8     469  13.7     662  19.4     843  24.7    1,013  29.7    3,415  100.0
Louisiana           150  4.9     192  6.2     334  10.8     369  12.0   1,001  32.5    1,038  33.7    3,084  100.0

Maine                23  2.1      67  6.0     141  12.7     236  21.2     271  24.3      376  33.8    1,114  100.0
Maryland            214  4.3     334  6.7     644  12.8     884  17.6   1,328  26.4    1,618  32.2    5,022  100.0
Massachusetts       216  2.8     376  4.9     704   9.2   1,172  15.4   2,311  30.3    2,838  37.3    7,617  100.0
Michigan            310  3.3     561  6.0   1,147  12.3   1,802  19.4   2,553  27.5    2,923  31.4    9,296  100.0
Minnesota            74  1.9     228  6.0     426  11.1     661  17.3   1,067  27.9    1,374  35.9    3,830  100.0

Mississippi         119  6.1     158  8.0     287  14.6     357  18.2     506  25.7      539  27.4    1,966  100.0
Missouri            152  4.1     263  7.1     384  10.4     466  12.7   1,089  29.6    1,326  36.0    3,680  100.0
Montana              21  2.2      54  5.8     126  13.5     191  20.4     267  28.6      276  29.5      935  100.0
Nebraska             41  2.3     112  6.2     208  11.5     347  19.1     531  29.3      574  31.7    1,813  100.0
Nevada               25  2.0      67  5.3     164  13.0     244  19.3     351  27.8      413  32.7    1,264  100.0

New Jersey          313  3.5     578  6.5   1,027  11.5   1,616  18.1   2,472  27.6    2,942  32.9    8,948  100.0
New Mexico           49  3.8      91  7.1     180  14.0     230  17.8     347  26.9      392  30.4    1,289  100.0
New York          1,102  3.6   1,902  6.2   3,728  12.1   5,678  18.4   8,294  26.9   10,127  32.8   30,831  100.0
 (City)             766  4.4   1,230  7.0   2,212  12.6   3,231  18.4   4,463  25.4    5,651  32.2   17,553  100.0
 (State)            336  2.5     672  5.1   1,516  11.4   2,447  18.4   3,831  28.9    4,476  33.7   13,278  100.0

N. Carolina         398  4.1     610  6.3   1,215  12.5   1,835  18.9   2,647  27.2    3,020  31.1    9,725  100.0
N. Dakota             3  0.6      18  3.8      38   8.0      63  13.3     176  37.1      177  37.3      475  100.0
Ohio                130  2.1     257  4.2     609   9.9   1,073  17.5   1,726  28.1    2,353  38.3    6,148  100.0
Oregon               75  2.3     207  6.3     423  12.9     655  20.0     894  27.4    1,013  31.0    3,267  100.0
Pennsylvania        484  3.9     822  6.6   1,516  12.1   2,152  17.2   3,562  28.4    4,000  31.9   12,536  100.0

Rhode Island         50  3.1      95  5.9     151   9.4     185  11.5     498  30.9      631  39.2    1,610  100.0
S. Carolina         120  3.6     187  5.6     350  10.5     646  19.3     955  28.6    1,084  32.4    3,342  100.0
S. Dakota             7  2.7      14  5.4      46  17.7      52  20.0      66  25.4       75  28.8      260  100.0
Tennessee           226  4.1     393  7.1     718  13.1     958  17.4   1,496  27.2    1,708  31.1    5,499  100.0
Texas               472  2.6     904  5.0   1,967  10.9   3,189  17.7   4,926  27.3    6,557  36.4   18,015  100.0

Utah                 37  3.2      70  6.1     121  10.6     181  15.8     324  28.4      409  35.8    1,142  100.0
Vermont              14  1.8      51  6.4      93  11.6     156  19.5     208  26.0      277  34.7      799  100.0
Virginia            238  3.2     454  6.1     875  11.8   1,341  18.0   2,111  28.4    2,411  32.4    7,430  100.0
Washington          174  2.5     411  6.0     878  12.8   1,301  19.0   1,846  27.0    2,239  32.7    6,849  100.0
W. Virginia          21  2.9      51  7.1      83  11.6     114  15.9     210  29.3      238  33.2      717  100.0
Wyoming               3  2.9       6  5.9      12  11.8      13  12.7      34  33.3       34  33.3      102  100.0

Total             6,336  3.4  11,419  6.1  21,920  11.8  33,056  17.8  51,607  27.8   61,529  33.1  185,867  100.0

Abortion ratio &    821          622          563           502           523            465            514
Abortion rate @       1           10           20            28            41             43             16
------------------------------------------------------------------------------------------------------------------
* All 39 states for which data are available and New York City.
+ Redistributed based on known distribution for 6 months of data.
& Calculated as the number of legal abortions obtained by women of a given age per 1,000 live births to women of the same age for these
  states.
@ Calculated as the number of legal abortions obtained by women of a given age per 1,000 women of the same age for these states.
=========================================================================================================================================
Return to top. Table_6 Note: To print large tables and graphs users may have to change their printer settings to landscape and use a small font size.
TABLE 6. Reported legal abortions, by weeks of gestation and state of occurrence -- selected states, * United States, 1990
=============================================================================================================================================
                                                               Weeks of gestation
                     -----------------------------------------------------------------------------------------------------
                         <=8            9-10          11-12          13-15          16-20           >=21         Unknown         Total
                     ------------   ------------   ------------   ------------   ------------   ------------   -----------   --------------
State                  No.    %       No.    %       No.    %       No.     %     No.      %     No.      %     No.     %       No.     %
-------------------------------------------------------------------------------------------------------------------------------------------
Arkansas              3,340  56.1    1,437  24.1      577   9.7      260   4.4      83    1.4      19    0.3     237   4.0     5,953  100.0
Colorado              4,496  35.5    4,638  36.6    2,001  15.8      937   7.4     426    3.4     126    1.0      55   0.4    12,679  100.0
Dist. of Columbia    10,831  54.2    3,753  18.8    2,348  11.8    1,511   7.6   1,089 +  5.5      56 &  0.3     381   1.9    19,969  100.0
Georgia              14,464  36.9   10,785  27.5    6,444  16.4    3,160   8.1   1,766    4.5     746    1.9   1,880   4.8    39,245  100.0
Hawaii @              2,109  44.4    1,138  24.0      577  12.2      373   7.9     390    8.2      54    1.1     107   2.3     4,748  100.0

Idaho                   635  45.7      470  33.8      260  18.7       15   1.1       8    0.6       1    0.1       1   0.1     1,390  100.0
Indiana              10,308  71.8    2,795  19.5      760   5.3       97   0.7      21    0.1       0    0.0     370   2.6    14,351  100.0
Kansas @              2,783  38.7    1,955  27.2    1,041  14.5      589   8.2     522    7.3     272    3.8      24   0.3     7,186  100.0
Kentucky **           5,073  46.5    2,177  19.9    1,298  11.9      901   8.3   1,009    9.2     379    3.5      84   0.8    10,921  100.0
Louisiana             5,526  42.4    4,113  31.6    1,570  12.1      792   6.1     831    6.4     141    1.1      47   0.4    13,020  100.0

Maine @               2,317  50.3    1,314  28.5      586  12.7      320   6.9      37    0.8       0    0.0      33   0.7     4,607  100.0
Maryland @           11,676  52.1    5,838  26.0    2,874  12.8    1,223   5.5     736    3.3      19    0.1      59   0.3    22,425  100.0
Michigan             21,016  58.1    7,736  21.4    3,364   9.3    2,688   7.4   1,284    3.5      92    0.3       3   0.0    36,183  100.0
Minnesota             8,327  48.5    4,544  26.5    2,153  12.5    1,097   6.4     878    5.1      85    0.5      72   0.4    17,156  100.0
Mississippi           3,287  48.0    1,887  27.6      949  13.9      413   6.0     107    1.6      10    0.1     189   2.8     6,842  100.0

Missouri ++           6,458  39.5    5,313  32.5    2,775  17.0    1,195   7.3     568    3.5      47    0.3      10   0.1    16,366  100.0
Montana @             2,049  60.9      600  17.8      365  10.8      213   6.3     129    3.8       0    0.0       9   0.3     3,365  100.0
Nevada                4,537  62.8    1,374  19.0      667   9.2      390   5.4     214    3.0       1    0.0      43   0.6     7,226  100.0
New Jersey @         21,367  51.7    8,357  20.2    3,469   8.4    4,366  10.6   3,041    7.4     758    1.8       0   0.0    41,358  100.0
New Mexico            2,613  49.4    1,012  19.1      454   8.6      331   6.3     273    5.2      31    0.6     574  10.9     5,288  100.0

New York             79,604  50.0   38,026  23.9   18,078  11.4   10,115   6.4   6,742    4.2   2,081    1.3   4,452   2.8   159,098  100.0
 (City)              50,647  49.6   23,427  22.9   11,519  11.3    6,683   6.5   5,245    5.1   1,865    1.8   2,816   2.8   102,202  100.0
 (State)             28,957  50.9   14,599  25.7    6,559  11.5    3,432   6.0   1,497    2.6     216    0.4   1,636   2.9    56,896  100.0
N. Carolina          17,939  49.2    8,840  24.2    4,783  13.1    2,633   7.2     883    2.4      73    0.2   1,343   3.7    36,494  100.0
N. Dakota @             937  54.4      422  24.5      191  11.1      153   8.9      14    0.8       0    0.0       6   0.3     1,723  100.0

Oregon                6,050  44.3    4,378  32.1    1,508  11.0      742   5.4     528    3.9     221    1.6     231   1.7    13,658  100.0
Pennsylvania         25,568  49.0   14,147  27.1    6,890  13.2    3,250   6.2   1,793    3.4     420    0.8      75   0.1    52,143  100.0
Rhode Island @        4,541  58.4    1,927  24.8      655   8.4      431   5.5     191    2.5      11    0.1      26   0.3     7,782  100.0
S. Carolina           7,514  56.6    3,671  27.6    1,606  12.1      272   2.0      71    0.5      32    0.2     119   0.9    13,285  100.0
S. Dakota               608  64.3      262  27.7       72   7.6        4   0.4       0    0.0       0    0.0       0   0.0       946  100.0

Tennessee @          10,775  51.0    5,998  28.4    2,699  12.8    1,426   6.7     208    1.0      18    0.1      20   0.1    21,144  100.0
Texas @              48,410  52.3   22,205  24.0   10,176  11.0    6,159   6.7   4,223    4.6   1,294    1.4     113   0.1    92,580  100.0
Utah                  3,168  66.2      756  15.8      386   8.1      226   4.7     170    3.6       4    0.1      76   1.6     4,786  100.0
Vermont               1,698  53.3      961  30.2      375  11.8      126   4.0      17    0.5       6    0.2       1   0.0     3,184  100.0
Virginia @           19,882  60.3    8,794  26.7    2,974   9.0      473   1.4     649    2.0     128    0.4      92   0.3    32,992  100.0

Washington @         18,973  60.3    7,381  23.5    2,344   7.5    1,205   3.8   1,203    3.8     284    0.9      53   0.2    31,443  100.0
W. Virginia ++          585  23.4    1,092  43.7      575  23.0      178   7.1      61    2.4       9    0.4       0   0.0     2,500  100.0
Wisconsin             8,225  48.8    4,411  26.2    2,087  12.4    1,256   7.5     684    4.1     185    1.1       0   0.0    16,848  100.0
Wyoming @               176  48.5      152  41.9       34   9.4        0   0.0       0    0.0       1    0.3       0   0.0       363  100.0

Total               397,865  50.9  194,659  24.9   89,965  11.5   49,520   6.3  30,849    3.9   7,604    1.0  10,785   1.4   781,247  100.0
-------------------------------------------------------------------------------------------------------------------------------------------
 * All 36 states for which data are available, the District of Columbia, and New York City; excludes two states where unknown gestational
   age is >15%
 + Includes 16-19 weeks only.
 & Includes >=20 weeks gestation.
 @ Weeks of gestation are based on physician's estimate.
** Redistributed based on known distribution for 6 months of data.
++ Weeks of gestation are based on physician's estimate if date of last menstrual period is unknown.
=============================================================================================================================================
Return to top. Table_7 Note: To print large tables and graphs users may have to change their printer settings to landscape and use a small font size.
TABLE 7. Reported legal abortions, by type of procedure and state of occurrence -- selected states, * United States, 1990
=========================================================================================================================================================================
                                                                                Procedure
                  --------------------------------------------------------------------------------------------------------------------------------
                                                                       Intrauterine
                      Suction            Sharp                            saline       Prostaglandin   Hysterotomy/
                     curettage         curettage      All curettage    instillation    instillation    hysterectomy    Other +         Unknown              Total
                  ----------------   --------------   --------------   -------------   -------------   ------------   ----------   ---------------    -----------------
State               No.        %      No.       %       No.      %      No.       %      No.      %       No.    %     No.    %      No.       %        No.         %
-----------------------------------------------------------------------------------------------------------------------------------------------------------------------
Arizona            14,945     94.7      14      0.1    14,959   94.8       5     0.0        0    0.0        0   0.0       0  0.0      819      5.2     15,783     100.0
Arkansas            5,737 &   96.4      71      1.2     5,808   97.6       2     0.0       15    0.3        3   0.1      38  0.6       87      1.5      5,953     100.0
Colorado           12,447 &   98.2      20      0.2    12,467   98.3       4     0.0       50    0.4        1   0.0       0  0.0      157      1.2     12,679     100.0
Dist. of Col.      19,610     98.2      24      0.1    19,634   98.3       2     0.0        0    0.0        0   0.0      25  0.1      308      1.5     19,969     100.0
Georgia            34,114 &   86.9   4,130     10.5    38,244   97.4      11     0.0      957    2.4        3   0.0       0  0.0       30      0.1     39,245     100.0

Hawaii              4,642     97.8      19      0.4     4,661   98.2       0     0.0       11    0.2        0   0.0      53  1.1       23      0.5      4,748     100.0
Idaho               1,387 &   99.8       1      0.1     1,388   99.9       2     0.1        0    0.0        0   0.0       0  0.0        0      0.0      1,390     100.0
Indiana            14,033 &   97.8      10      0.1    14,043   97.9       2     0.0        0    0.0        2   0.0     228  1.6       76      0.5     14,351     100.0
Kansas              7,180     99.9       4      0.1     7,184  100.0       0     0.0        1    0.0        0   0.0       1  0.0        0      0.0      7,186     100.0
Kentucky @         10,717 &   98.1      16      0.1    10,733   98.3       4     0.0       13    0.1        2   0.0      18  0.2      151      1.4     10,921     100.0

Louisiana          12,820 &   98.5      71      0.5    12,891   99.0       0     0.0        0    0.0        1   0.0       0  0.0      128      1.0     13,020     100.0
Maine               4,390 &   95.3     207      4.5     4,597   99.8       4     0.1        2    0.0        0   0.0       4  0.1        0      0.0      4,607     100.0
Maryland           21,692     96.7     148      0.7    21,840   97.4     130     0.6      303    1.4        2   0.0     149  0.7        1      0.0     22,425     100.0
Massachusetts      38,133     96.0     493      1.2    38,626   97.2      24     0.1      591    1.5        0   0.0     498  1.3        0      0.0     39,739     100.0
Michigan           36,123 &   99.8       0      0.0    36,123   99.8       2     0.0       57    0.2        0   0.0       1  0.0        0      0.0     36,183     100.0

Minnesota          17,146 &   99.9       5      0.0    17,151  100.0       1     0.0        2    0.0        0   0.0       2  0.0        0      0.0     17,156     100.0
Mississippi         6,806 &   99.5       1      0.0     6,807   99.5       2     0.0       26    0.4        4   0.1       1  0.0        2      0.0      6,842     100.0
Missouri           16,248 &   99.3      10      0.1    16,258   99.3       0     0.0       29    0.2        0   0.0      45  0.3       34      0.2     16,366     100.0
Montana             3,364 &  100.0       0      0.0     3,364  100.0       0     0.0        0    0.0        0   0.0       1  0.0        0      0.0      3,365     100.0
Nebraska            6,254     98.5       2      0.0     6,256   98.6       0     0.0        0    0.0       23   0.4      13  0.2       56      0.9      6,348 **  100.0

Nevada              7,168 &   99.2      11      0.2     7,179   99.3       1     0.0        2    0.0        0   0.0       0  0.0       44      0.6      7,226     100.0
New Jersey         34,585     83.6   6,302     15.2    40,887   98.9     372     0.9       47    0.1       25   0.1      27  0.1        0      0.0     41,358     100.0
New Mexico          4,903     92.7      36      0.7     4,939   93.4     298     5.6        0    0.0        0   0.0       1  0.0       50      0.9      5,288     100.0
New York          142,917     89.8   1,339      0.8   144,256   90.7   1,375     0.9      251    0.2        7   0.0     331  0.2   12,878      8.1    159,098     100.0
  (City)           92,931 &   90.9   1,070      1.0    94,001   92.0   1,058     1.0       55    0.1        5   0.0      41  0.0    7,042      6.9    102,202     100.0
  (State)          49,986 &   87.9     269      0.5    50,255   88.3     317     0.6      196    0.3        2   0.0     290  0.5    5,836 ++  10.3     56,896     100.0

N. Carolina        35,319     96.8      99      0.3    35,418   97.1     223     0.6      239    0.7        9   0.0     238  0.7      367      1.0     36,494     100.0
N. Dakota           1,719 &   99.8       1      0.1     1,720   99.8       0     0.0        0    0.0        1   0.1       1  0.1        1      0.1      1,723     100.0
Ohio               29,768     70.9   9,878 &&  23.5    39,646   94.4       0     0.0        0    0.0        7   0.0   1,335  3.2    1,018      2.4     42,006 **  100.0
Oregon             13,497 &   98.8      12      0.1    13,509   98.9       1     0.0        3    0.0        5   0.0      24  0.2      116      0.8     13,658     100.0
Pennsylvania       51,859 &   99.5      26      0.0    51,885   99.5      15     0.0       28    0.1        4   0.0     211  0.4        0      0.0     52,143     100.0

Rhode Island        7,736 &   99.4       3      0.0     7,739   99.4       4     0.1        9    0.1        0   0.0       7  0.1       23      0.3      7,782     100.0
S. Carolina        13,207 &   99.4       2      0.0    13,209   99.4      15     0.1       35    0.3        6   0.0      17  0.1        3      0.0     13,285     100.0
S. Dakota             946 &  100.0       0      0.0       946  100.0       0     0.0        0    0.0        0   0.0       0  0.0        0      0.0        946     100.0
Tennessee          21,089 &   99.7       1      0.0    21,090   99.7       4 @@  0.0       47    0.2        2   0.0       1  0.0        0      0.0     21,144     100.0
Texas              91,880 &   99.2       0      0.0    91,880   99.2     275     0.3       --    --        19   0.0     139  0.2      267      0.3     92,580     100.0

Utah                4,369 &   91.3     391      8.2     4,760   99.5       1     0.0        1    0.0        1   0.0       6  0.1       17      0.4      4,786     100.0
Vermont             3,164 &   99.4       2      0.1     3,166   99.4       0     0.0        1    0.0        1   0.0      16  0.5        0      0.0      3,184     100.0
Virginia           31,805 &   96.4      27      0.1    31,832   96.5      38     0.1       68    0.2        3   0.0      50  0.2    1,001      3.0     32,992     100.0
Washington         31,319 &   99.6       8      0.0    31,327   99.6       8     0.0       97    0.3        4   0.0       5  0.0        2      0.0     31,443     100.0
W. Virginia         1,292 &   51.7       0      0.0     1,292   51.7       0     0.0    1,202   48.1        0   0.0       0  0.0        6      0.2      2,500     100.0
Wyoming               357 &   98.3       0      0.0       357   98.3       0     0.0        0    0.0        0   0.0       0  0.0        6      1.7        363     100.0

Total             816,687     94.1  23,384      2.7   840,071   96.8   2,825     0.3    4,087    0.5      135   0.0   3,486  0.4   17,671      2.0    868,275     100.0
-----------------------------------------------------------------------------------------------------------------------------------------------------------------------
 * All 39 states for which data are available, the District of Columbia, and New York City.
 + Includes instillation procedures not reported as a specific category and procedures reported as "other."
 & Includes dilatation and evacuation procedures.
 @ Redistributed based on known distribution for 6 months of data.
** Does not add to total abortions reported because of some reported combination procedures.
++ Approximately 4,000 of the unknown procedures were a combination of procedures for which the primary procedure could not be determined.
&& Reported as dilatation and curettage procedures.
@@ Includes prostaglandin combined with saline procedure.

-- Not reported.
=========================================================================================================================================================================
Return to top. Table_8 Note: To print large tables and graphs users may have to change their printer settings to landscape and use a small font size.
TABLE 8. Reported legal abortions, by race and state of occurrence -- selected states, *
United States, 1990
==================================================================================================
                                                  Race
                     ---------------------------------------------------------
                        White +          Black           Other       Unknown          Total
                     -------------   --------------   -----------   ----------    --------------
State                  No.     %      No.       %      No.    %      No.    %       No.     %
------------------------------------------------------------------------------------------------
Arizona               12,718  80.6      777     4.9     753   4.8   1,535  9.7     15,783  100.0
Arkansas               4,165  70.0    1,666    28.0      65   1.1      57  1.0      5,953  100.0
Dist. of Columbia      4,545  22.8   12,247    61.3   2,861  14.3     316  1.6     19,969  100.0
Georgia               20,548  52.4   17,209    43.9   1,488   3.8       0  0.0     39,245  100.0
Idaho                  1,335  96.0        5     0.4      43   3.1       7  0.5      1,390  100.0
Indiana               10,605  73.9    3,143    21.9     220   1.5     383  2.7     14,351  100.0
Kansas                 5,950  82.8    1,020    14.2     113   1.6     103  1.4      7,186  100.0
Kentucky &             8,763  80.2    1,823    16.7     218   2.0     117  1.1     10,921  100.0
Louisiana              7,260  55.8    5,530 @  42.5      --   --      230  1.8     13,020  100.0
Maine                  4,434  96.2       57     1.2     116   2.5       0  0.0      4,607  100.0
Maryland              10,741  47.9   10,442    46.6     900   4.0     342  1.5     22,425  100.0
Minnesota             14,833  86.5    1,114     6.5     807   4.7     402  2.3     17,156  100.0
Mississippi            3,335  48.7    3,439    50.3      45   0.7      23  0.3      6,842  100.0
Missouri              10,350  63.2    5,682    34.7     298   1.8      36  0.2     16,366  100.0
Nevada                 6,500  90.0      538     7.4     170   2.4      18  0.2      7,226  100.0
New Jersey            22,852  55.3   16,700    40.4   1,596   3.9     210  0.5     41,358  100.0
New Mexico             4,725  89.4      122     2.3     441   8.3       0  0.0      5,288  100.0
New York              85,733  53.9   62,559    39.3   4,235   2.7   6,571  4.1    159,098  100.0
  (City)              43,984  43.0   51,359    50.3   3,639   3.6   3,220  3.2    102,202  100.0
  (State)             41,749  73.4   11,200    19.7     596   1.0   3,351  5.9     56,896  100.0
N. Carolina           20,984  57.5   13,328    36.5   1,078   3.0   1,104  3.0     36,494  100.0
N. Dakota              1,582  91.8       23     1.3     117   6.8       1  0.1      1,723  100.0
Oregon                11,986  87.8      571     4.2     557   4.1     544  4.0     13,658  100.0
Rhode Island           6,430  82.6      913    11.7     343   4.4      96  1.2      7,782  100.0
S. Carolina            7,501  56.5    5,597    42.1     181   1.4       6  0.0     13,285  100.0
S. Dakota                865  91.4       12     1.3      69   7.3       0  0.0        946  100.0
Tennessee             13,784  65.2    6,865    32.5     205   1.0     290  1.4     21,144  100.0
Texas                 70,689  76.4   18,427    19.9   3,218   3.5     246  0.3     92,580  100.0
Utah                   4,384  91.6      100     2.1     260   5.4      42  0.9      4,786  100.0
Vermont                3,131  98.3       13     0.4      28   0.9      12  0.4      3,184  100.0
Virginia              20,436  61.9   11,424    34.6     952   2.9     180  0.5     32,992  100.0
W. Virginia            2,180  87.2      299    12.0      17   0.7       4  0.2      2,500  100.0
Wisconsin             13,209  78.4    3,187    18.9     418   2.5      34  0.2     16,848  100.0

Total                416,553  63.5  204,832    31.2  21,812   3.3  12,909  2.0    656,106  100.0

Abortion ratio **        258            521 ++          335 &&                        309
------------------------------------------------------------------------------------------------
 * All 30 states for which data are available, the District of Columbia, and New York City;
   excludes six states where unknown race is >15%.
 + White race includes those of Hispanic ethnicity.
 & Redistributed based on known distribution for 6 months of data.
 @ Includes black and other races.
** Calculated as the number of legal abortions obtained by women of a given race per 1,000
   live births to women of the same race for these states. For each state, abortions obtained
   by women of unknown race were distributed according to known race distribution for that
   state. Excludes states reporting race unknown for >15% of women having abortions.
++ Ratio for black race excludes Kentucky because live births for blacks and others were
   grouped together.
&& Ratio for other race excludes Louisiana because abortions for blacks and others were
   grouped together.
-- Not reported.
==================================================================================================
Return to top. Table_9 Note: To print large tables and graphs users may have to change their printer settings to landscape and use a small font size.
TABLE 9. Reported legal abortions, by Hispanic origin and state of occurrence --
selected states, * United States, 1990
==============================================================================================
                       Hispanic             Total
                     -------------     ---------------
  State                No.     %         No.      %
------------------------------------------------------
  Arizona             2,848   18.0      15,783   100.0
  Arkansas               19    0.3       5,953   100.0
  Georgia               394    1.0      39,245   100.0
  Idaho                  51    3.7       1,390   100.0
  Kansas                170    2.4       7,186   100.0
  Minnesota             154    0.9      17,156   100.0
  Mississippi            11    0.2       6,842   100.0
  Missouri              159    1.0      16,366   100.0
  Nevada                273    3.8       7,226   100.0
  New Jersey          5,780   14.0      41,358   100.0
  New Mexico          2,111   39.9       5,288   100.0
  New York           25,293   15.9     159,098   100.0
    (City)           23,288   22.8     102,202   100.0
    (State)           2,005    3.5      56,896   100.0
  North Dakota           13    0.8       1,723   100.0
  Oregon                431    3.2      13,658   100.0
  Rhode Island           55    0.7       7,782   100.0
  South Carolina        104    0.8      13,285   100.0
  Tennessee             107    0.5      21,144   100.0
  Texas              23,364   25.2      92,580   100.0
  Utah                  316    6.6       4,786   100.0
  Vermont                22    0.7       3,184   100.0
  Virginia              830    2.5      32,992   100.0
  Wisconsin             529    3.1      16,848   100.0

  Total              63,034   11.9     530,873   100.0

  Abortion ratio +      258                320
------------------------------------------------------
* All 22 states for which data are available and New York City.
+ Calculated as the number of legal abortions obtained by women of Hispanic origin per 1,000
  live births to women of Hispanic origin for these states.
==============================================================================================
Return to top. Table_10 Note: To print large tables and graphs users may have to change their printer settings to landscape and use a small font size.
TABLE 10. Reported legal abortions, by marital status and state of occurrence --
selected states, * United States, 1990
=================================================================================================
                                   Marital status
                    -------------------------------------------
                     Married +      Unmarried &       Unknown          Total
                    ------------    ------------    -----------    --------------
State                No.     %       No.     %       No.     %       No.     %
---------------------------------------------------------------------------------
Arkansas             1,227  20.6     4,540  76.3      186   3.1      5,953  100.0
Colorado             2,498  19.7     9,971  78.6      210   1.7     12,679  100.0
Georgia              8,071  20.6    30,836  78.6      338   0.9     39,245  100.0
Hawaii               1,195  25.2     3,501  73.7       52   1.1      4,748  100.0
Idaho                  329  23.7     1,057  76.0        4   0.3      1,390  100.0
Indiana              2,792  19.5    11,226  78.2      333   2.3     14,351  100.0
Kansas               1,373  19.1     5,813  80.9        0   0.0      7,186  100.0
Kentucky @           1,942  17.8     8,770  80.3      209   1.9     10,921  100.0
Maine                  939  20.4     3,449  74.9      219   4.8      4,607  100.0
Maryland             4,756  21.2    16,698  74.5      971   4.3     22,425  100.0
Massachusetts        8,488  21.4    26,992  67.9    4,259  10.7     39,739  100.0
Michigan             6,452  17.8    29,406  81.3      325   0.9     36,183  100.0
Minnesota            3,225  18.8    13,232  77.1      699   4.1     17,156  100.0
Mississippi          1,322  19.3     5,489  80.2       31   0.5      6,842  100.0
Missouri             3,542  21.6    12,609  77.0      215   1.3     16,366  100.0
Montana                631  18.8     2,477  73.6      257   7.6      3,365  100.0
Nevada               1,868  25.9     5,256  72.7      102   1.4      7,226  100.0
New Jersey           8,681  21.0    32,536  78.7      141   0.3     41,358  100.0
New Mexico           1,058  20.0     4,161  78.7       69   1.3      5,288  100.0
New York (City)     22,532  22.0    77,019  75.4    2,651   2.6    102,202  100.0
N. Carolina          8,537  23.4    26,880  73.7    1,077   3.0     36,494  100.0
N. Dakota              340  19.7     1,382  80.2        1   0.1      1,723  100.0
Ohio                 5,515  17.1    24,057  74.8    2,593   8.1     32,165  100.0
Oregon               3,332  24.4    10,132  74.2      194   1.4     13,658  100.0
Rhode Island         1,800  23.1     5,911  76.0       71   0.9      7,782  100.0
S. Carolina          2,817  21.2    10,433  78.5       35   0.3     13,285  100.0
S. Dakota              190  20.1       756  79.9        0   0.0        946  100.0
Tennessee            4,398  20.8    16,626  78.6      120   0.6     21,144  100.0
Texas               22,284  24.1    69,417  75.0      879   0.9     92,580  100.0
Utah                 1,811  37.8     2,975  62.2        0   0.0      4,786  100.0
Vermont                696  21.9     2,251  70.7      237   7.4      3,184  100.0
Virginia             6,094  18.5    25,874  78.4    1,024   3.1     32,992  100.0
W. Virginia            530  21.2     1,967  78.7        3   0.1      2,500  100.0
Wisconsin            2,523  15.0    14,232  84.5       93   0.6     16,848  100.0
Wyoming                 91  25.1       272  74.9        0   0.0        363  100.0

Total              143,879  21.2   518,203  76.2   17,598   2.6    679,680  100.0

Abortion ratio **       89             879                             298
---------------------------------------------------------------------------------
 * All 34 states for which data are available and New York City; excludes three states where
   unknown marital status is >15%.
 + Married includes married and separated, unless otherwise specified.
 & Unmarried includes never married, divorced, and widowed, unless otherwise specified.
 @ Redistributed based on known distribution for 6 months of data.
** Calculated as the number of legal abortions obtained by women of a given marital status
   per 1,000 live births to women of the same marital status for these states. For each state,
   abortions obtained by women of unknown marital status are distributed according to known
   marital status distribution for that state. Excludes states reporting marital status unknown
   for >15% of women having abortions. Also excludes Michigan and Nevada because they
   do not have denominator data.
=================================================================================================
Return to top. Table_11 Note: To print large tables and graphs users may have to change their printer settings to landscape and use a small font size.
TABLE 11. Reported legal abortions, by number of previous live births and state of occurrence -- selected states,* United
States, 1990
===========================================================================================================================================
                                                Number of previous live births
                 --------------------------------------------------------------------------------------------
                      0               1               2               3              >=4           Unknown           Total
                 ------------    ------------    ------------    ------------    ------------    ------------    --------------
State             No.     %       No.     %       No.     %       No.     %       No.      %      No.     %        No.     %
-------------------------------------------------------------------------------------------------------------------------------
Arizona           7,095  45.0     3,679  23.3     2,579  16.3     1,116   7.1       600   3.8       714   4.5     15,783  100.0
Arkansas          2,846  47.8     1,627  27.3       996  16.7       325   5.5       122   2.0        37   0.6      5,953  100.0
Colorado          7,233  57.0     2,567  20.2     1,904  15.0       665   5.2       251   2.0        59   0.5     12,679  100.0
Georgia          19,979  50.9     9,996  25.5     6,125  15.6     2,000   5.1       836   2.1       309   0.8     39,245  100.0
Hawaii            2,265  47.7     1,031  21.7       861  18.1       294   6.2       156   3.3       141   3.0      4,748  100.0

Idaho               686  49.4       310  22.3       238  17.1       103   7.4        48   3.5         5   0.4      1,390  100.0
Indiana           6,924  48.2     3,539  24.7     2,536  17.7       794   5.5       354   2.5       204   1.4     14,351  100.0
Kansas            4,102  57.1     1,516  21.1     1,066  14.8       354   4.9       137   1.9        11   0.2      7,186  100.0
Kentucky +        5,934  54.3     2,554  23.4     1,507  13.8       484   4.4       242   2.2       200   1.8     10,921  100.0
Maine             2,584  56.1       952  20.7       665  14.4       207   4.5        75   1.6       124   2.7      4,607  100.0

Maryland         10,426  46.5     5,978  26.7     3,819  17.0     1,212   5.4       621   2.8       369   1.6     22,425  100.0
Michigan         17,615  48.7     8,908  24.6     6,283  17.4     2,260   6.2     1,109   3.1         8   0.0     36,183  100.0
Minnesota         9,841  57.4     3,366  19.6     2,532  14.8       906   5.3       509   3.0         2   0.0     17,156  100.0
Mississippi       3,204  46.8     1,843  26.9     1,177  17.2       427   6.2       188   2.7         3   0.0      6,842  100.0
Missouri          7,472  45.7     4,287  26.2     2,950  18.0     1,125   6.9       346   2.1       186   1.1     16,366  100.0

Montana           1,908  56.7       615  18.3       521  15.5       222   6.6        99   2.9         0   0.0      3,365  100.0
Nebraska          3,527  55.6     1,258  19.8       998  15.7       400   6.3       163   2.6         0   0.0      6,346  100.0
Nevada            3,190  44.1     1,876  26.0     1,382  19.1       455   6.3       265   3.7        58   0.8      7,226  100.0
New Jersey       18,149  43.9    10,949  26.5     8,059  19.5     2,856   6.9     1,345   3.3         0   0.0     41,358  100.0
New Mexico        2,588  48.9     1,262  23.9       850  16.1       344   6.5       148   2.8        96   1.8      5,288  100.0

New York         68,731  43.2    37,617  23.6    28,036  17.6    11,282   7.1     6,476   4.1     6,956   4.4    159,098  100.0
  (City)         36,254  35.5    26,137  25.6    19,549  19.1     8,129   8.0     5,177   5.1     6,956   6.8    102,202  100.0
  (State)        32,477  57.1    11,480  20.2     8,487  14.9     3,153   5.5     1,299   2.3         0   0.0     56,896  100.0
N. Carolina      17,882  49.0     8,352  22.9     4,791  13.1     1,511   4.1     3,958  10.8         0   0.0     36,494  100.0
N. Dakota         1,004  58.3       286  16.6       265  15.4       115   6.7        53   3.1         0   0.0      1,723  100.0

Oregon            6,615  48.4     3,004  22.0     2,337  17.1       811   5.9       372   2.7       519   3.8     13,658  100.0
Pennsylvania     26,725  51.3    12,679  24.3     8,492  16.3     2,923   5.6     1,276   2.4        48   0.1     52,143  100.0
Rhode Island      4,327  55.6     1,665  21.4     1,145  14.7       436   5.6       202   2.6         7   0.1      7,782  100.0
S. Carolina       6,687  50.3     3,578  26.9     2,064  15.5       701   5.3       251   1.9         4   0.0     13,285  100.0
S. Dakota           522  55.2       165  17.4       160  16.9        76   8.0        23   2.4         0   0.0        946  100.0

Tennessee        10,635  50.3     5,671  26.8     3,343  15.8     1,048   5.0       431   2.0        16   0.1     21,144  100.0
Texas            45,298  48.9    22,755  24.6    15,976  17.3     5,630   6.1     2,863   3.1        58   0.1     92,580  100.0
Utah              2,322  48.5     1,052  22.0       851  17.8       358   7.5       183   3.8        20   0.4      4,786  100.0
Vermont           1,931  60.6       568  17.8       470  14.8       141   4.4        71   2.2         3   0.1      3,184  100.0
Virginia         17,529  53.1     7,843  23.8     5,093  15.4     1,639   5.0       783   2.4       105   0.3     32,992  100.0
Washington       15,712  50.0     7,245  23.0     5,434  17.3     1,960   6.2       836   2.7       256   0.8     31,443  100.0
W. Virginia       1,323  52.9       657  26.3       332  13.3       136   5.4        45   1.8         7   0.3      2,500  100.0
Wyoming             185  51.0        77  21.2        70  19.3        19   5.2        10   2.8         2   0.6        363  100.0

Total           364,996  48.4   181,327  24.1   125,907  16.7    45,335   6.0    25,447   3.4    10,527   1.4    753,539  100.0

Abortion
  ratio &           358             230             317             302             271                              303
-------------------------------------------------------------------------------------------------------------------------------
* All 36 states for which data are available and New York City; excludes two states where number of unknown previous live births is >15%.
+ Redistributed based on known distribution for 6 months of data.
& Calculated as the number of legal abortions obtained by women with a given number of previous live births per 1,000 live births to
  women with the same number of previous live births for these states. For each state, abortions obtained by women whose number of
  previous live births is unknown are distributed according to known number of previous live births for that state. Excludes states
  reporting number of previous live births unknown for >15% of women having abortions.
===========================================================================================================================================
Return to top. Table_12 Note: To print large tables and graphs users may have to change their printer settings to landscape and use a small font size.
TABLE 12. Reported legal abortions, by number of previous induced legal abortions and state of occurrence -- selected
states, * United States, 1990
========================================================================================================================================
                                          Number of previous induced abortions
                      ----------------------------------------------------------------------------
                           0               1               2              >=3           Unknown           Total
                      ------------    ------------    ------------    ------------    ------------    --------------
State                  No.     %       No.     %       No.     %       No.     %       No.     %        No.     %
--------------------------------------------------------------------------------------------------------------------
Arizona                9,967  63.2     4,047  25.6     1,226   7.8       543   3.4         0   0.0     15,783  100.0
Arkansas               4,122  69.2     1,386  23.3       302   5.1       100   1.7        43   0.7      5,953  100.0
Colorado               7,739  61.0     3,255  25.7     1,076   8.5       534   4.2        75   0.6     12,679  100.0
Dist. of Columbia      9,108  45.6     6,213  31.1     2,674  13.4     1,595   8.0       379   1.9     19,969  100.0
Georgia               23,668  60.3    10,177  25.9     3,367   8.6     1,458   3.7       575   1.5     39,245  100.0

Hawaii                 2,340  49.3     1,243  26.2       597  12.6       442   9.3       126   2.7      4,748  100.0
Idaho                  1,030  74.1       256  18.4        73   5.3        26   1.9         5   0.4      1,390  100.0
indiana                9,209  64.2     3,435  23.9       990   6.9       417   2.9       300   2.1     14,351  100.0
Kansas                 4,703  65.4     1,769  24.6       505   7.0       193   2.7        16   0.2      7,186  100.0
Kentucky +             7,167  65.6     2,408  22.0       579   5.3       229   2.1       538   4.9     10,921  100.0

Maine                  3,031  65.8     1,055  22.9       305   6.6       141   3.1        75   1.6      4,607  100.0
Maryland              10,076  44.9     7,513  33.5     3,036  13.5     1,579   7.0       221   1.0     22,425  100.0
Michigan              20,250  56.0     9,756  27.0     3,847  10.6     2,168   6.0       162   0.4     36,183  100.0
Minnesota             10,973  64.0     4,144  24.2     1,323   7.7       714   4.2         2   0.0     17,156  100.0
Mississippi            4,524  66.1     1,572  23.0       538   7.9       205   3.0         3   0.0      6,842  100.0

Missouri              10,094  61.7     4,313  26.4     1,333   8.1       570   3.5        56   0.3     16,366  100.0
Montana                2,373  70.5       712  21.2       179   5.3       101   3.0         0   0.0      3,365  100.0
Nebraska               4,297  67.7     1,406  22.2       401   6.3       196   3.1        46   0.7      6,346  100.0
Nevada                 3,331  46.1     2,132  29.5       984  13.6       739  10.2        40   0.6      7,226  100.0
New Jersey            19,697  47.6    12,358  29.9     5,638  13.6     3,665   8.9         0   0.0     41,358  100.0

New Mexico             3,265  61.7     1,214  23.0       440   8.3       369   7.0         0   0.0      5,288  100.0
New York              72,972  45.9    42,051  26.4    21,681  13.6    15,321   9.6     7,073   4.4    159,098  100.0
  (City)              40,061  39.2    29,211  28.6    16,847  16.5    12,834  12.6     3,249   3.2    102,202  100.0
  (State)             32,911  57.8    12,840  22.6     4,834   8.5     2,487   4.4     3,824   6.7     56,896  100.0
N. Carolina           21,990  60.3     8,854  24.3     2,460   6.7       949   2.6     2,241   6.1     36,494  100.0

N. Dakota              1,235  71.7       365  21.2       100   5.8        23   1.3         0   0.0      1,723  100.0
Oregon                 7,509  55.0     3,718  27.2     1,336   9.8       827   6.1       268   2.0     13,658  100.0
Pennsylvania          31,723  60.8    13,748  26.4     4,391   8.4     2,216   4.2        65   0.1     52,143  100.0
Rhode Island           4,764  61.2     1,980  25.4       691   8.9       332   4.3        15   0.2      7,782  100.0
S. Carolina            8,625  64.9     3,396  25.6       908   6.8       353   2.7         3   0.0     13,285  100.0

S. Dakota                788  83.3       134  14.2        20   2.1         4   0.4         0   0.0        946  100.0
Tennessee             13,823  65.4     5,070  24.0     1,542   7.3       691   3.3        18   0.1     21,144  100.0
Texas                 57,009  61.6    24,690  26.7     7,474   8.1     3,252   3.5       155   0.2     92,580  100.0
Utah                   3,077  64.3     1,155  24.1       337   7.0       199   4.2        18   0.4      4,786  100.0
Vermont                1,983  62.3       773  24.3       284   8.9       139   4.4         5   0.2      3,184  100.0

Virginia              19,376  58.7     8,738  26.5     2,717   8.2     2,099   6.4        62   0.2     32,992  100.0
Washington            16,802  53.4     8,602  27.4     3,488  11.1     2,288   7.3       263   0.8     31,443  100.0
W. Virginia            1,763  70.5       527  21.1       150   6.0        60   2.4         0   0.0      2,500  100.0
Wyoming                  251  69.1        72  19.8        28   7.7        10   2.8         2   0.6        363  100.0

Total                434,654  56.2   204,237  26.4    77,020  10.0    44,747   5.8    12,850   1.7    773,508  100.0
--------------------------------------------------------------------------------------------------------------------
* All 36 states for which data are available, the District of Columbia, and New York City; excludes two states where number of unknown
  previous induced abortions is >15%.
+ Redistributed based on known distribution for 6 months of data.
========================================================================================================================================
Return to top. Table_13 Note: To print large tables and graphs users may have to change their printer settings to landscape and use a small font size.
TABLE 13. Number and percentage of reported legal abortions, by race, age group,
and marital status -- United States, 1990
==================================================================================
                                  Race
                    ---------------------------------
                       White +          Black/other           Total
Age group/          --------------     --------------     --------------
marital status *      No.      %         No.      %         No.      %
------------------------------------------------------------------------
Age group (yrs)
    <15               2,215    0.6       2,597    1.3       4,812    0.8
  15-19              88,731   22.3      41,597   20.1     130,328   21.5
  20-24             132,427   33.2      68,922   33.3     201,349   33.2
  25-29              87,044   21.8      49,242   23.8     136,286   22.5
  30-34              52,741   13.2      28,171   13.6      80,912   13.4
  35-39              27,571    6.9      12,919    6.3      40,490    6.7
   >=40               8,022    2.0       3,229    1.6      11,251    1.9

Total &             398,751  100.0     206,677  100.0     605,428  100.0

Marital status
  Married            80,883   23.8      36,770   19.3     117,653   22.2
  Unmarried         259,627   76.2     153,523   80.7     413,150   77.8

Total @             340,510  100.0     190,293  100.0     530,803  100.0
------------------------------------------------------------------------
* Excludes unknowns.
+ Includes Hispanics.
& Reported by 30 states and New York City.
@ Reported by 28 states and New York City.
==================================================================================
Return to top. Table_14 Note: To print large tables and graphs users may have to change their printer settings to landscape and use a small font size.
TABLE 14. Number and percentage of reported legal abortions, by weeks of gestation, age group, and race -- United States, 1990
=========================================================================================================================================
                                                          Weeks of gestation
                  --------------------------------------------------------------------------------------------------
                       <=8             9-10             11-12            13-15            16-20            >=21              Total
Age group/        -------------    -------------    -------------    -------------    -------------    -------------     --------------
race *              No.     %        No.     %        No.     %        No.     %        No.     %        No.     %         No.     %
---------------------------------------------------------------------------------------------------------------------------------------
Age group
  (yrs)
    <15             2,090  36.5      1,423  24.9        932  16.3        605  10.6        512   8.9        160   2.8       5,722  100.0
  15-19            68,751  43.3     42,220  26.6     22,498  14.2     13,708   8.6      9,199   5.8      2,522   1.6     158,898  100.0
  20-24           121,171  50.0     63,124  26.1     29,793  12.3     16,317   6.7      9,513   3.9      2,329   1.0     242,247  100.0
  25-29            89,642  55.0     40,681  25.0     17,248  10.6      8,907   5.5      5,194   3.2      1,198   0.7     162,870  100.0
  30-34            57,220  58.5     23,504  24.0      9,282   9.5      4,484   4.6      2,658   2.7        678   0.7      97,826  100.0
  35-39            29,748  60.4     11,495  23.3      4,234   8.6      1,974   4.0      1,447   2.9        346   0.7      49,244  100.0
   >=40             8,380  61.6      3,114  22.9      1,077   7.9        538   4.0        407   3.0         92   0.7      13,608  100.0

Total +           377,002  51.6    185,561  25.4     85,064  11.6     46,533   6.4     28,930   4.0      7,325   1.0     730,415  100.0

Race
  White           206,679  54.0     96,095  25.1     41,463  10.8     21,720   5.7     13,238   3.5      3,766   1.0     382,961  100.0
  Black/other      93,584  46.1     52,655  26.0     27,745  13.7     16,020   7.9     10,328   5.1      2,550   1.3     202,882  100.0

Total &           300,263  51.3    148,750  25.4     69,208  11.8     37,740   6.4     23,566   4.0      6,316   1.1     585,843  100.0
---------------------------------------------------------------------------------------------------------------------------------------
* Excludes unknowns.
+ Reported by 35 states and New York City.
& Reported by 29 states and New York City.
=========================================================================================================================================
Return to top. Figure_1 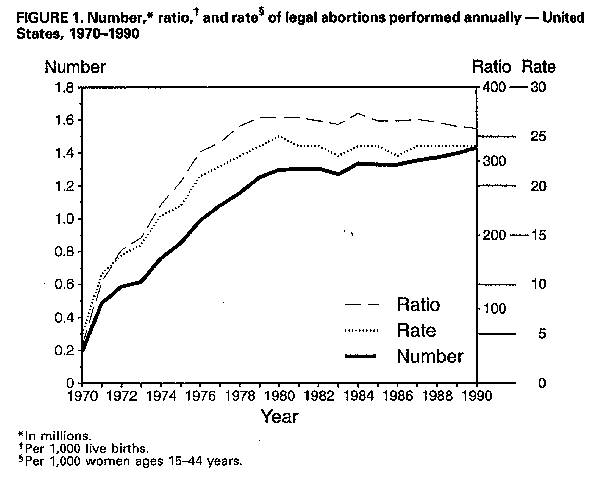 Return to top. Table_15 Note: To print large tables and graphs users may have to change their printer settings to landscape and use a small font size.
TABLE 15. Number and percentage of reported legal abortions, by weeks of gestation and procedure -- United States, 1990
=================================================================================================================================================
                                                            Weeks of gestation
                  --------------------------------------------------------------------------------------------------------
                       <=8               9-10             11-12             13-15             16-20              >=21               Total
Type of           --------------    --------------    --------------    --------------    --------------    --------------     ----------------
procedure *         No.      %        No.      %        No.      %        No.      %        No.      %        No.      %         No.     %
-----------------------------------------------------------------------------------------------------------------------------------------------
Curettage
  (suction or
  sharp) +        370,588   99.8    182,383   99.6     83,280   99.4     44,731   98.2     24,799   87.7      5,953   83.4     711,734   99.0
Intrauterine
  saline
  instillation         65    0.0 &       67    0.0 &       62    0.1        332    0.7      1,562    5.5        445    6.2       2,533    0.4
Intrauterine
  prostaglandin
  instillation        300    0.1        540    0.3        330    0.4        269    0.6      1,181    4.2        617    8.6       3,237    0.5
Hysterotomy/
  hysterectomy         49    0.0 &        9    0.0 &        8    0.0 &        7    0.0 &       17    0.1          7    0.1          97    0.0 &
Other                 330    0.1         69    0.0 &       95    0.1        223    0.5        714    2.5        117    1.6       1,548    0.2

Total @           371,332  100.0    183,068  100.0     83,775  100.0     45,562  100.0     28,273  100.0      7,139  100.0     719,149  100.0
-----------------------------------------------------------------------------------------------------------------------------------------------
* Excludes unknowns.
+ Includes dilatation and evacuation.
& <=0.05%.
@ Reported by 35 states and New York City.
=================================================================================================================================================
Return to top. Figure_2 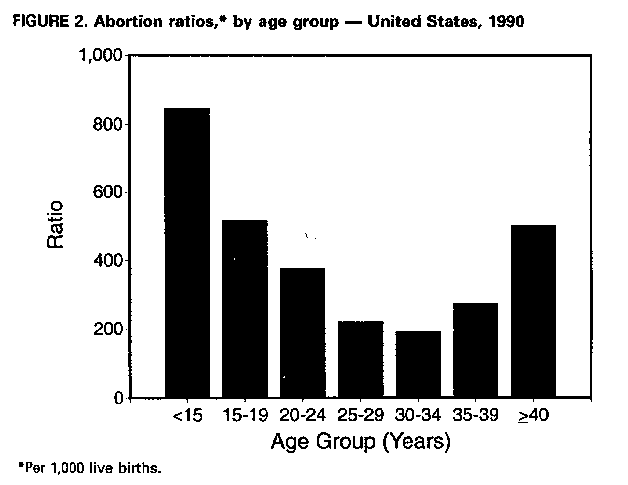 Return to top. Figure_3 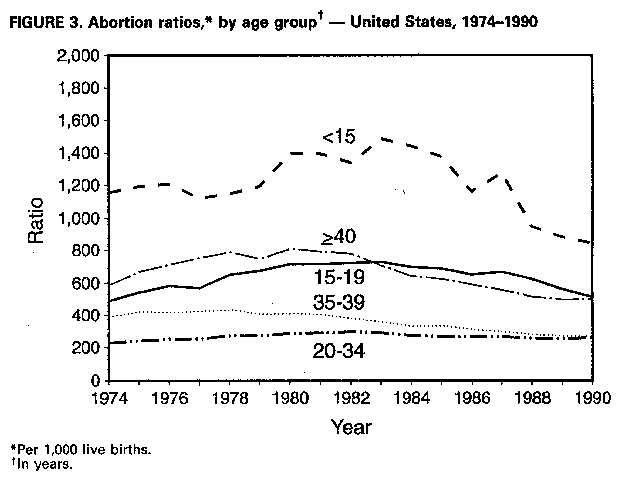 Return to top. Figure_4  Return to top. Disclaimer All MMWR HTML versions of articles are electronic conversions from ASCII text into HTML. This conversion may have resulted in character translation or format errors in the HTML version. Users should not rely on this HTML document, but are referred to the electronic PDF version and/or the original MMWR paper copy for the official text, figures, and tables. An original paper copy of this issue can be obtained from the Superintendent of Documents, U.S. Government Printing Office (GPO), Washington, DC 20402-9371; telephone: (202) 512-1800. Contact GPO for current prices. **Questions or messages regarding errors in formatting should be addressed to mmwrq@cdc.gov.Page converted: 09/19/98 |
|||||||||
This page last reviewed 5/2/01
|