|
THE
SUN'S CHILLY IMPACT ON EARTH A
new NASA computer climate model reinforces the long-standing theory that low solar
activity could have changed the atmospheric circulation in the Northern Hemisphere
from the 1400s to the 1700s and triggered a "Little Ice Age" in several
regions including North America and Europe. Changes in the sun's energy was one
of the biggest factors influencing climate change during this period, but have
since been superceded by greenhouse gases due to the industrial revolution.
 |

|
 |
| Image
2 | "Sports
on a Frozen River" (detail)
Aert van der Neer
Courtesy: The Metropolitan Museum of Art | During
the Little Ice Age, access to Greenland was largely cut off by ice from 1410 to
the 1720s. At the same time, canals in Holland routinely froze solid, glaciers
advanced in the Alps, and sea-ice increased so much that no open water was present
in any direction around Iceland in 1695.
|

|
|
| Image
3 | "Winter
Scene with Frozen Canal" (detail)
by Aert van der Neer
Courtesy: Fine Arts Museums of San Francisco, Gift of Mr. & Mrs. Prentis Cobb
Hale 1960.35 | Drew
Shindell of NASA's Goddard Institute for Space Studies and other researchers have
used a computer model to reconstruct climate and atmospheric conditions from the
present back to the Little Ice Age. They
determined that a dimmer Sun reduced the model's westerly winds, cooling the continents
during wintertime. Shindell's model shows large regional climate changes, unlike
other climate models that show relatively small temperature changes on an overall
global scale. Other models did not assess regional changes. During
the coldest part of the Little Ice Age, from 1645 to 1715, there is believed to
have been a decrease in the total energy output from the Sun, as indicated by
little or no sunspot activity. Known as the Maunder Minimum, astronomers of the
time observed only about 50 sunspots for a 30-year period as opposed to a more
typical
40-50,000 spots. The Sun normally shows signs of variability, such
as its eleven-year sunspot cycle. Within that time, it goes from a minimum to
a maximum period of activity represented by a peak in sunspots and flare activity.
|

|
|
| Image
5 | Galileo's
Sunspots | Beginning
in 1611, Galileo Galilei made drawings of lower sunspot activity before the Maunder
Minimum. Records of sunspot activity during the Minimum from other astronomers
confirm the lower number of sunspots over the70 year event. During
those periods of low solar activity, levels of the Sun's ultraviolet radiation
decrease, and can significantly impact ozone formation in the stratosphere. "The
changes in ozone that we modeled were key in producing the enhanced response,"
Shindell said. "The changes in the upper atmosphere then feed down to the
surface climate." Between
the mid-1600s and the early 1700s the Earth's surface temperatures in the Northern
Hemisphere appear to have been at or near their lowest values of the last millennium.
European winter temperatures over that time period were reduced by 1.8 to 2.7
degrees Fahrenheit (1-1.5 Celsius). This cool down is evident through derived
temperature readings from tree rings and ice cores, and in historical temperature
records, as gathered by the University of Massachusetts-Amherst and the University
of Virginia.
|
|
|
| Image
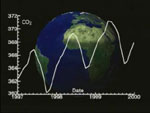
7 | Climate
Change Today | Shindell
noted that the effects of this period of a dimmer Sun were concentrated more regionally
than globally. "Global average temperature changes are small, approximately
.5 to .7 degrees Fahrenheit (0.3-0.4C), but regional temperature changes are quite
large." Shindell said that his climate model simulation shows the temperature
changes occurring mostly because of a change in the Arctic Oscillation/North Atlantic
Oscillation (AO/NAO). This
oscillation is basically a hemispheric-scale see-saw of atmospheric pressure and
temperature between the mid latitudes and the Arctic which modulates the strength
of the westerly jet stream winds. These winds are reduced as the AO/NAO shifts
in response to a dimmer sun. Because the oceans are relatively warm during the
winter due to their large heat capacity, the diminished flow creates cold land
temperatures by reducing the transport of warm Pacific air to America, and warm
Atlantic air to Europe. During this shift, winter temperatures cooling of as much
as 2 to 4 degrees Fahrenheit (1-2C). The
paper, "Solar forcing of regional climate change during the Maunder Minimum,"
by authors Drew Shindell, Gavin Schmidt, and David Rind, from NASA's Goddard Institute
for Space Studies and co-authors Michael Mann and Anne Waple, from the Universities
of Virginia and Massachusetts respectively, appears in the December 7 issue of
Science. "The
period of low solar activity in the middle ages led to atmospheric changes that
seem to have brought on the Little Ice Age. However, we need to keep in mind that
variations in solar output have had far less impact on the Earth's recent climate
than human actions," Shindell said. "The biggest catalyst for climate
change today are greenhouse gases," he added.
Back
to Top |