|
NASA
DEMONSTRATES HOW EARTH'S GLOBAL HEAT ENGINE DRIVES PLANT GROWTH
Scientists at
NASA's Goddard Space Flight Center have assembled the first
long-term global data set that demonstrates the connection
between changing patterns of sea surface temperature and patterns
of plant growth across the Earth's landscapes. The results
of their new study appear in the April 2001 issue of the Journal
of Climate.
"For the
first time, we can see patterns of climate variability reflected
in land vegetation growth, globally, which was not possible
before," states Sietse Los, the paper's lead author.
"Until now, we haven't had a good data set to show us
how vegetation changes over long periods of time."
 |
|
| |
|
Image
1
|
| |
Since
land vegetation absorbs carbon dioxide from the atmosphere,
through the process of photosynthesis, and ultimately releases
the greenhouse gas back into the atmosphere through decomposition
and fires, the authors wanted to gain new insights into where
there are large variations in plant growth. Such variations
have implications for the spatial distribution of carbon sources
and sinks, and how they change over time. Although seasonal
variations in plant growth can be large, growth can also vary
widely from one year to the next. Moreover, recent studies
suggest that due to global warming the growing season is getting
longer at higher latitudes, thereby increasing the ability
of terrestrial plants to serve as a carbon sink.
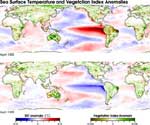
As part of Compton
Tucker's (a co-author) satellite data processing effort, the
team reprocessed nine years of NOAA Advanced Very High Resolution
Radiometer (AVHRR) data--from January 1982 through December
1990--into a series of one-month global composite images of
sea surface temperature and plant productivity (indicated
by the normalized difference vegetation index, or NDVI). The
authors note that AVHRR is a broadband remote sensor designed
primarily to look at snow and clouds, not vegetation. Because
the sensor did not have strong calibration and orbital requirements,
as compared to today's satellite technologies for measuring
vegetation, the authors had to painstakingly fine-tune each
image to correct for errors that interfere with its interpretation,
such as aerosol particles in the atmosphere.
"Using various
analysis techniques, we can now extract signals from the vegetation
data that relate to the climate system," Los states.
"And we can now correlate vegetative response to climate
change in three dimensions--through time and space."
Since submitting
their paper for publication, the team has processed another
nine years of AVHRR data so that they now have a continuous
18-year global data set of sea surface temperature and vegetation
measurements. When viewing the monthly false-color images
consecutively in a time-series animation, distinct large-scale
patterns of change become quickly obvious to the eye. Reds
representing unusually warm waters wax and wane across patches
of ocean while the greens of vigorous plant growth, or the
browns of drought, roll across landscapes in response.
Co-author James
Collatz points to the recurring cycles of the El Nino-Southern
Oscillation in the equatorial Pacific and Southern Atlantic
during the 1980s. Then he notes the subsequent patterns of
drought and vigorous growth that sweep back and forth across
South America, as if the continent were the ball in an ongoing
ping-pong match between the two mighty oceans.
"What it
shows is what you might expect," he observes. "Sea
surface temperatures have an impact on the climate (temperature
and precipitation) over land and this affects growth of vegetation."
Dubbed the "global
heat engine," Earth scientists have long since recognized
that as the ocean releases warmth and moisture into the overlying
atmosphere it dramatically influences weather patterns. Anomalously
high sea surface temperature, as seen in the equatorial Pacific
during El Nino, can drive weather patterns to extremes--producing
torrential rains and flooding in some parts of the world and
severe drought in others.
But, say the
paper's authors, you cannot expect El Nino to always have
the same effects on plant growth across a given region. The
impacts of some El Ninos are more intense than others.
"Climate
oscillations can sometimes interact with one another,"
explains Collatz. "For instance, the effects of El Nino
are sometimes magnified and at other times almost completely
cancelled out by the North Atlantic Oscillation (NAO)."
Ultimately, say
the authors, this new data set strengthens scientists' ability
to forecast the effects of climate change on vegetation on
a global scale. But in order to improve their predictions
of what impacts El Nino might have, they need to know what
other climate oscillations might affect the strength of El
Nino.
"Natural
resources, food--lots of things depend upon the healthy growth
of vegetation," concludes Collatz. "It is important
for us to understand and be able to predict how forests and
crops will respond to climate cycles like El Nino."
Toward that objective,
scientists now have almost 20 years of global observations
to give them a perspective they've never had before. With
this new data they can begin to examine in more detail the
roles of the terrestrial biosphere in both the carbon and
water cycles.
There are new
NASA satellite sensors now in orbit that are much better calibrated
than AVHRR and specifically designed to measure the Earth's
vegetation. Even as they improve upon the quality of the measurements,
these sensors--such as the Sea-viewing Wide Field-of-view
Sensor (SeaWiFS), flying aboard OrbView-2, and the Moderate-resolution
Imaging Spectroradiometer (MODIS), flying aboard Terra--will
extend the heritage of the AVHRR data set well into the new
millennium.
Back
to top
|


