| Average
Surface Dewpoint Data (info) |
Model
700 mb Dewpoint (info) |
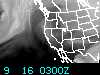
Satellite
Precipitable Water Imagery (info) |
 |
 |
 |
| Model
Precipitable Water (info) |
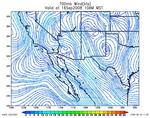
Model
700 mb Winds (info) |
Model
500 mb Winds (info) |
 |
 |
 |
| Model
300 mb Winds (info) |
Model
500 mb Heights (info) |
Satellite
Vegetation (info) |
 |
 |
 |
| Satellite
Water Vapor Imagery (info) |
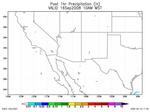
Past
1 hour estimated rainfall total from radar (info) |
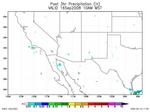
Past
3
hour estimated rainfall total from radar |
 |
 |  |
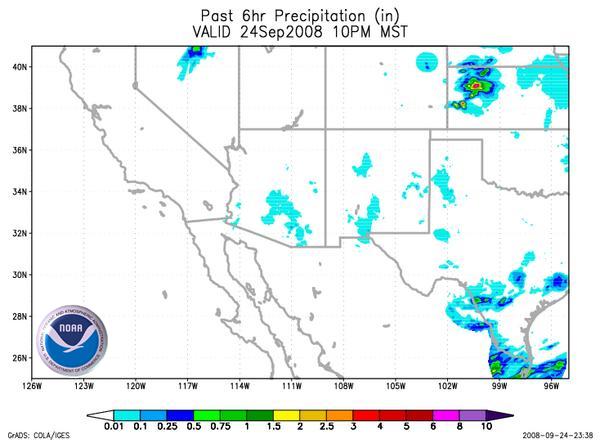
| Past
6 hour estimated rainfall total from radar |
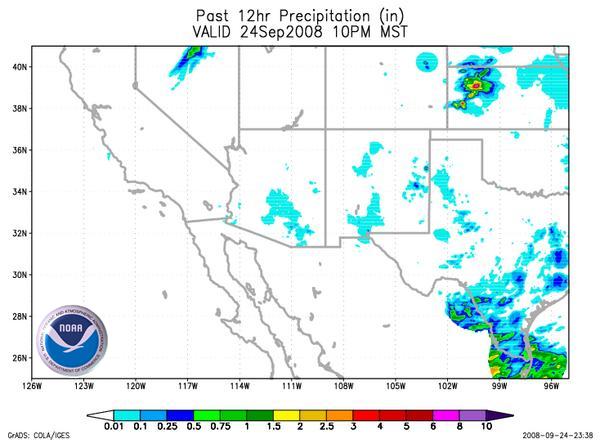
Past
12 hour estimated rainfall total from radar |
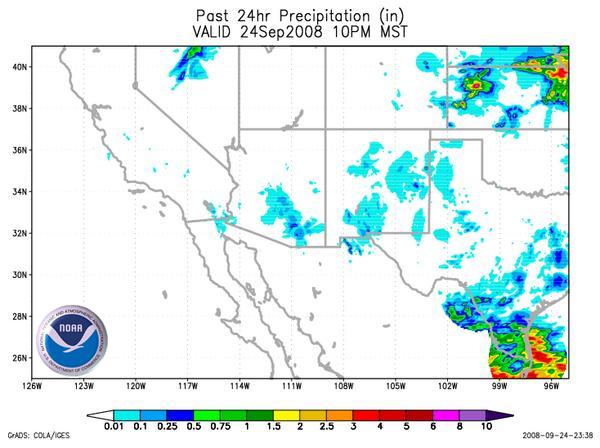
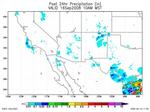
Past
24
hour estimated rainfall total from radar |
 |
 |
 |