
 |
|
 |
![]()

Healthy
People ... tracking the Nation's
health
|
Healthy People 2010
Progress Review
Focus Area 20
Occupational Safety and Health Presentation
Slide 1
Title slide for the February 21st, 2008 Healthy People 2010 Focus Area 20 data presentation by Dr. Edward Sondik
Slide 2
Burden of occupational injuries and illnesses slide.
In 2006 there were 5,703 work-related injury deaths in the U.S. or about 16 deaths per day, more than 4 million new nonfatal injuries and illnesses reported in the private industry alone, 3,857,400 injuries, and 228,000 illnesses. The Estimated cost of occupational injuries and illnesses are $128 - $155 Billion dollars annually.
Rates and counts of injuries and illnesses in 2006 are shown based on data provided by the U.S. Department of Labor, Bureau of Labor Statistics (DOL, BLS). Also shown is the estimated U.S. cost for these injuries and illnesses based on research by Paul A. Schulte in: Characterizing the burden of occupational injury and disease. Journal of Occupational and Environmental Medicine 2005;47(6):607–22
Slide 3
This slide contains Healthy People 2010 objectives highlighted for this Progress Review categorized by
Target Met or Exceeded:
-
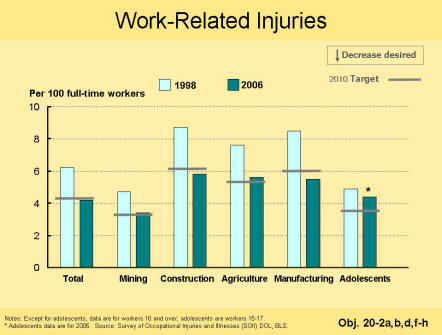
20-2a,b,g Work-related injuries
-
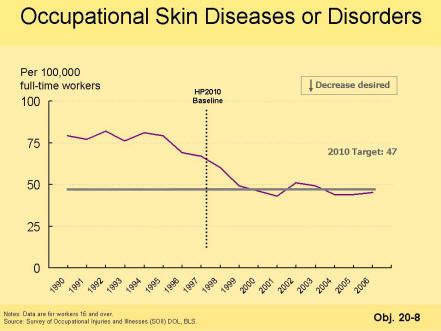
20-8 Occupational skin diseases or disorders
Made progress towards their target:
-
20-1a,c Work-related injury deaths
-
20-2d,f,h Work-related injuries
-
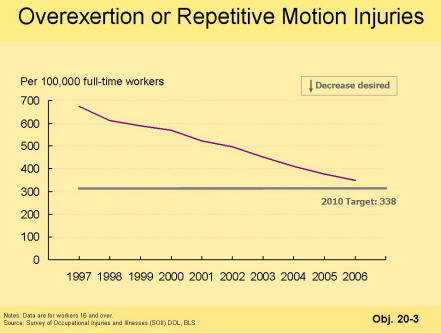
20-3 Overexertion or repetitive motion injuries
-
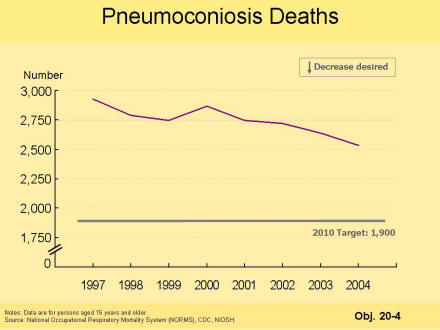
20-4 Pneumoconiosis deaths
-
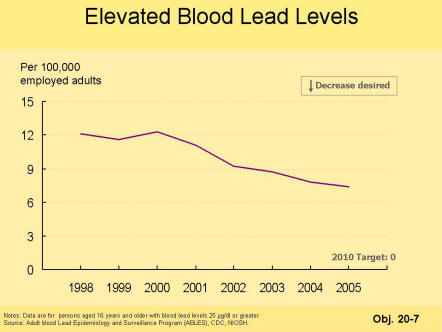
20-7 Elevated blood lead levels
Moved away from their Healthy People targets:
-
20-1b,e Work-related injury deaths
Data are from the Healthy People DATA2010.
Slide 4
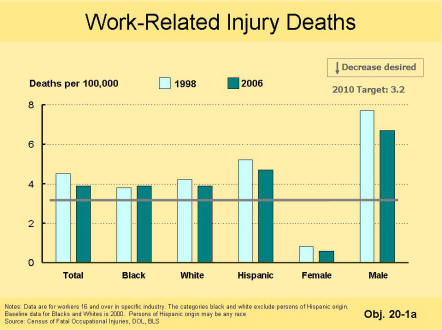
This slide contains data for work-related injury deaths by race, ethnicity, and gender in 1998 and 2006, per 100,000 full-time workers. Data are from the Census of Fatal Occupational Injuries and Illnesses (CFOII), DOL, BLS.
Slide 5
This slide contains trends in work-related injury deaths between 1998 and 2006 for the total population, and separately for the agricultural, construction, and mining industries.

Slide 6
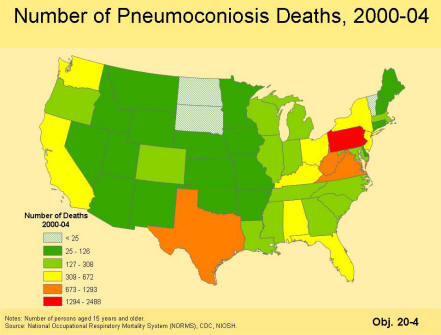
This slide contains the number of pneumoconiosis deaths for the period 2000 to 2004 by state as a color coded map with six categories of number of deaths. Data are from National Occupational Respiratory Mortality System (NORMS), Centers for Disease Control and Prevention, National Institute of Occupational Safety and Health (CDC, NIOSH).
Slide 7
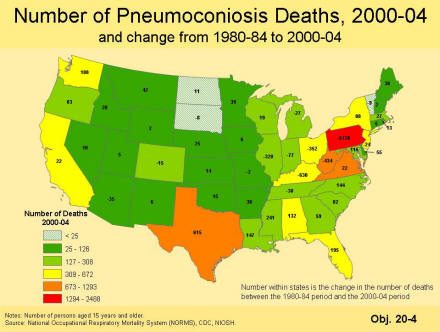
This slide contains the number of pneumoconiosis deaths for the period 2000 to 2004 by state as a color coded map with six categories of number of deaths. Added to the previous map are the changes in the number of deaths by state between the 1980 to 1984 period and the 2000 to 2004 period. Data are from NORMS, CDC, NIOSH.
Slide 8
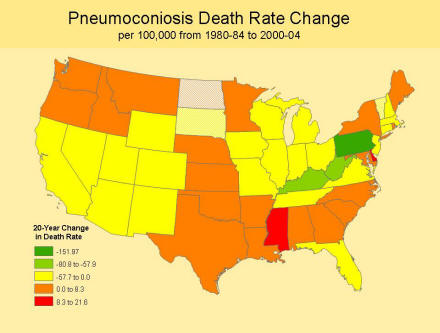
This slide contains the change in the age-adjusted death rate from pneumoconiosis between the 1980 to 1984 period and the 2000 to 2004 period. The change in rates is displayed as a color coded map with 5 categories. Data are from NORMS, CDC, NIOSH.
Slide 9
This slide contains the trend in pneumoconiosis deaths for the total population between 1997 and 2004. Data are from NORMS, CDC, NIOSH
Slide 10
This slide contains rates
of work-related injuries in 1998 and 2006, per 100 full-time workers. Data
are given separately for all workers; the mining, construction,
agricultural, and manufacturing industries. Also given are data for
adolescent workers for which the second data point is 2005. Data are from
the Survey of Occupational Injuries and Illnesses (SOII), DOL, BLS.
Slide 11
This slide contains data for overexertion or repetitive motion injuries, per 100,000 full-time workers, between 1997 and 2006. Data are from SOII, DOL, BLS.
Slide 12
This slide contains the trend in elevated (>= 25 micrograms / deciliter) blood-lead levels for the total population 16 years and older between 1998 and 2005, per 100,000 adult workers. Data are from the Adult blood Lead Epidemiology and Surveillance Program, CDC, NIOSH.
Slide 13
This slide contains the
trend in occupational skin diseases or disorders for the total population
between 1990 and 2006, per 100,000 adult workers. Data are from SOII, DOL,
BLS.
Slide 14
This slide summarizes by count the status of all Occupational Safety and Health objectives. 6 met or exceeded their target, 11 are improving, 3 are getting worse, none have little or no progress, one has no tracking data, none were dropped at midcourse, and one was retained as developmental.
Slide 15
This slide indicates that Progress Review data and slides can be found at: http://www.cdc.gov/nchs/hphome.htm.
Healthy People 2000 |
Healthy People 2010 | Related Links |
This page last reviewed
April 04, 2008
|
