| US Imports of Steel Mill Products | |||
| FOR Blooms, Billets and Slabs -- C & A |
|||
| Quantity in Metric Tons | |||
| Same Table - US Dollars |
Same Table - Average Unit Value |
||
| 'C & A' = Carbon and Alloy products, 'S' = Stainless products | |||
| Graph | Country | Census Data | License Data | |||||||||||||
|---|---|---|---|---|---|---|---|---|---|---|---|---|---|---|---|---|
| JUL07 | AUG07 | SEP07 | OCT07 | NOV07 | DEC07 | JAN08 | FEB08 | MAR08 | APR08 | MAY08 | JUN08 | JUL08 | AUG08 | SEP08 | ||
| M | WORLD | 722,311 | 520,300 | 321,793 | 749,652 | 313,537 | 348,474 | 408,530 | 491,765 | 403,963 | 670,189 | 402,592 | 539,563 | 590,893 | 394,675 | 179,498 |
| M | UKRAINE | 141,010 | 79,749 | 112,456 | 103,853 | 70,941 | 52,451 | 52,188 | 54,126 | 52,367 | 106,905 | 52,839 | 148,200 | 163,996 | 128,847 | . |
| M | CANADA | 88,287 | 72,504 | 70,547 | 97,987 | 83,015 | 69,744 | 105,262 | 107,922 | 105,138 | 130,518 | 79,346 | 100,868 | 124,443 | 50,872 | 9,480 |
| M | MEXICO | 188,721 | 101,724 | 85,078 | 133,479 | 55,048 | 127,180 | 120,677 | 131,235 | 125,117 | 128,908 | 119,020 | 91,377 | 87,510 | 50,644 | 82,204 |
| M | BRAZIL | 85,025 | 101,532 | 21,314 | 252,500 | 16,322 | 62,411 | 65,418 | 65,417 | 9,064 | 119,211 | 63,563 | 127,575 | 66,160 | 15,529 | 9,070 |
| M | RUSSIA | 100,552 | 54,506 | 251.4 | 20,238 | 40,535 | 58.6 | . | 51,184 | 50,362 | 97,278 | 53,552 | 44,229 | 89,755 | 106,027 | 40,375 |
| M | GERMANY | 1,661 | 8,375 | 9,850 | 19,591 | 3,931 | 15,443 | 751.5 | 1,677 | 2,472 | 910.5 | 15,870 | 12,267 | 10,148 | 693.8 | 5,825 |
| M | JAPAN | 10,641 | 36,235 | 196.7 | 534.8 | . | 358.5 | 37,047 | 240.7 | 382.9 | 37,268 | 903.5 | 1,202 | 35,165 | 1,360 | 3,317 |
| M | AUSTRALIA | 35,534 | 36,712 | . | 72,175 | . | 18.1 | . | 35,659 | . | 11,009 | . | 10,531 | 10,899 | . | . |
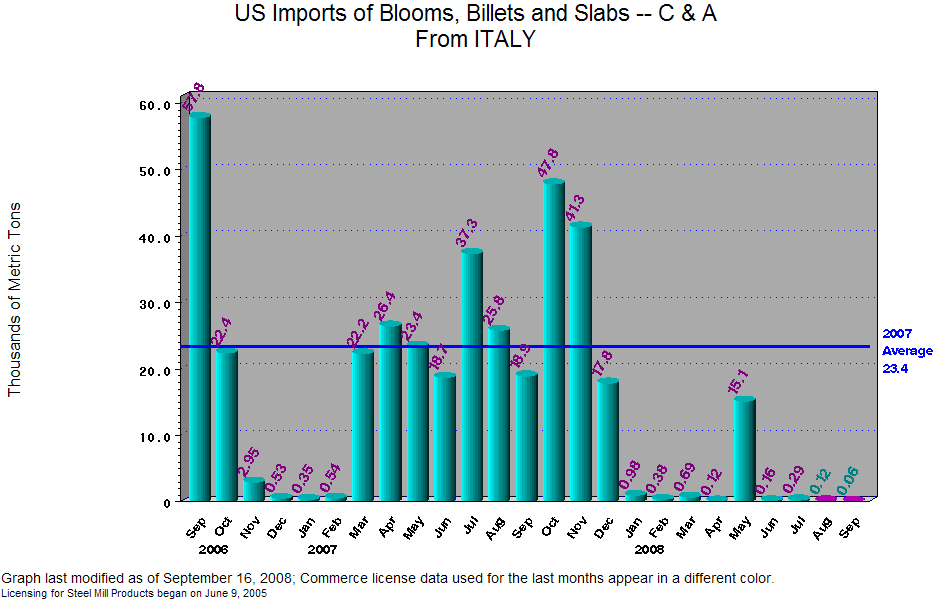
| M | ITALY | 37,391 | 25,829 | 18,959 | 47,878 | 41,365 | 17,887 | 984.8 | 380.4 | 695.1 | 121.5 | 15,156 | 164.2 | 290.2 | 128.7 | 61.3 |
| M | BELGIUM | 657.5 | 1,717 | 733.0 | 549.0 | 1,397 | 2,158 | 515.9 | 734.0 | 2,000 | 1,390 | 1,410 | 2,306 | 1,898 | 1,741 | 14.8 |
| M | SWITZERLAND | 422.8 | 747.1 | 561.5 | 194.0 | 320.9 | 36.5 | 212.2 | 163.8 | . | 795.5 | 531.1 | 334.6 | 235.3 | 11.5 | . |
| M | CHINA | 52.4 | . | 98.6 | 125.9 | 395.6 | 581.5 | 634.2 | 337.8 | 31.3 | 41.9 | 205.5 | 135.9 | 163.1 | 213.9 | 70.3 |
| M | UNITED KINGDOM | 405.6 | 665.9 | 359.6 | 309.5 | 135.8 | 37.0 | 21.0 | 58.8 | 38.5 | 86.1 | 94.2 | 95.3 | 145.1 | 70.1 | . |
| M | FRANCE | . | . | . | 234.2 | 85.1 | 100.0 | 152.7 | . | 50.9 | 120.1 | . | 180.6 | . | . | . |
| M | CZECH REPUBLIC | 87.5 | . | . | . | . | . | . | . | 14.1 | 70.1 | 50.8 | 92.6 | . | 58.2 | 44.9 |
| M | NETHERLANDS | . | . | . | . | . | . | . | . | . | . | . | . | 73.7 | . | . |
| M | SLOVENIA | 2.26 | . | . | . | . | 8.11 | . | . | 37.1 | . | 46.4 | . | . | . | . |
| M | INDIA | 31,856 | . | 1,385 | . | . | . | 24,662 | 42,021 | 433.4 | 35,552 | . | . | 9.00 | 38,469 | 29,032 |
| M | ARGENTINA | . | . | . | . | . | . | . | 605.2 | . | . | . | . | . | . | . |
| M | KOREA | . | . | . | . | 43.2 | . | . | . | . | . | . | . | . | . | . |
| M | POLAND | . | . | . | . | . | . | . | . | 55,756 | . | . | . | . | . | . |
| M | SWEDEN | . | . | . | . | . | . | . | . | . | . | . | . | . | 0.07 | . |
| M | TAIWAN | . | . | . | . | . | . | . | . | . | . | . | . | . | 0.00 | . |
| M | UNITED STATES | . | . | . | . | . | . | . | . | . | . | . | . | . | 5.23 | . |
| SOURCE: US Department of Commerce, Import Administration |
| Table last modified on: September 11, 2008, with |
| Licensing data collected through September 11, 2008 and |
| Final Census data compiled through July 2008 |
| Data listed in order of descending volume imported during last THREE months of census data,including preliminary data |
| Steel mill categories are defined by 10-digit HTS codes |
| To see License Data at HTS 6-digit level click on chart title at the top of the page. |
| Link to Annual Summary of Census Data |
| Link to Summary Level of Monthly Census Data |