| US Imports of Steel Mill Products | |||
| FOR Pipe & Tubing Nonclassified -- C & A |
|||
| Quantity in Metric Tons | |||
| Same Table - US Dollars |
Same Table - Average Unit Value |
||
| 'C & A' = Carbon and Alloy products, 'S' = Stainless products | |||
| Graph | Country | Census Data | Preliminary Census Data |
License Data | |||||||||||||
|---|---|---|---|---|---|---|---|---|---|---|---|---|---|---|---|---|---|
| JUL07 | AUG07 | SEP07 | OCT07 | NOV07 | DEC07 | JAN08 | FEB08 | MAR08 | APR08 | MAY08 | JUN08 | JUL08 | AUG08 | AUG08 | SEP08 | ||
| M | WORLD | 2,019 | 2,557 | 1,457 | 1,471 | 2,212 | 1,158 | 1,047 | 1,168 | 1,357 | 1,417 | 1,368 | 1,238 | 1,440 | 1,177 | 1,263 | 760.6 |
| M | CANADA | 621.8 | 844.7 | 691.6 | 673.3 | 413.6 | 384.9 | 349.3 | 591.1 | 669.2 | 611.3 | 792.5 | 807.6 | 771.1 | 732.3 | 800.6 | 476.8 |
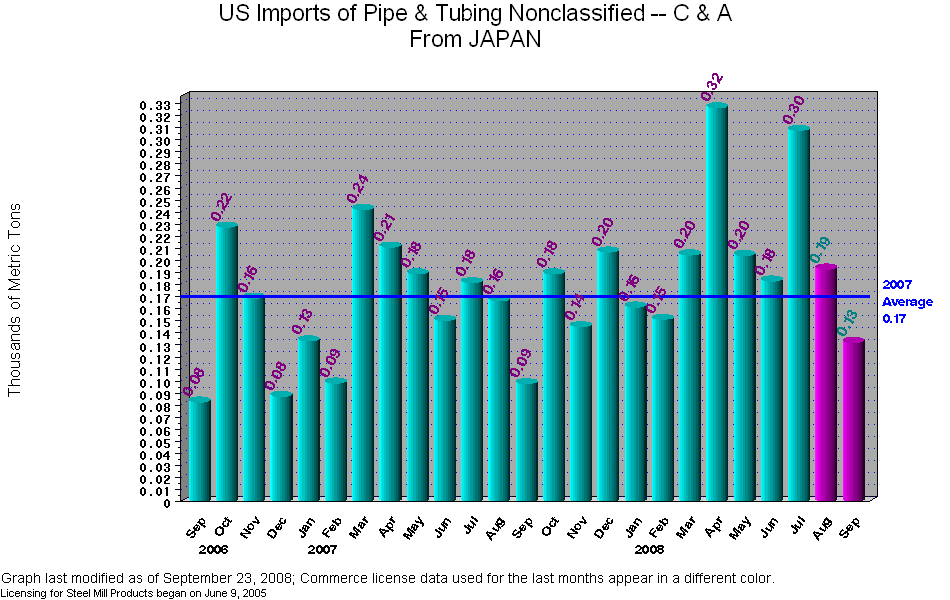
| M | JAPAN | 181.4 | 166.4 | 97.8 | 188.8 | 145.0 | 206.8 | 161.2 | 151.1 | 204.4 | 326.2 | 203.9 | 182.8 | 307.6 | 213.9 | 192.6 | 132.0 |
| M | MEXICO | 175.2 | 219.2 | 161.2 | 296.5 | 303.5 | 181.9 | 140.4 | 115.1 | 147.1 | 142.4 | 119.1 | 101.7 | 112.0 | 95.2 | 146.6 | 96.9 |
| M | CHINA | 710.1 | 1,171 | 290.6 | 114.1 | 1,240 | 84.4 | 77.7 | 49.8 | 101.0 | 72.5 | 80.2 | 36.6 | 123.8 | 73.7 | 84.0 | 51.2 |
| M | GERMANY | 12.6 | 26.9 | 31.6 | 9.76 | 38.6 | 65.1 | 5.55 | 82.4 | 89.6 | 166.8 | 19.8 | 8.13 | 46.3 | 12.9 | 14.6 | 0.12 |
| M | TAIWAN | . | . | 16.9 | 16.3 | . | 4.92 | . | 32.6 | 15.3 | . | . | 32.6 | 32.6 | 1.99 | 0.04 | . |
| M | UNITED KINGDOM | 5.42 | 9.51 | 4.11 | 14.7 | 1.38 | 0.75 | 25.3 | 4.27 | 6.53 | 8.95 | 2.69 | 31.4 | 6.51 | 12.6 | 2.61 | 0.26 |
| M | VIETNAM | 69.2 | 71.0 | 89.5 | 70.9 | . | 180.8 | 70.8 | 52.9 | 18.7 | 18.7 | . | 18.7 | . | 17.2 | . | . |
| M | KOREA | . | . | . | . | . | . | 168.5 | 33.2 | . | 0.12 | 0.28 | 0.94 | 21.4 | 0.10 | 0.10 | . |
| M | INDIA | 10.5 | 3.03 | 22.3 | 32.1 | 40.7 | 13.5 | 13.6 | 38.5 | 58.5 | 33.7 | 124.0 | 12.8 | 8.10 | . | 16.6 | 0.33 |
| M | ITALY | . | 4.54 | 0.13 | . | 1.05 | . | 1.90 | 0.99 | . | 4.69 | 20.4 | 2.13 | 1.67 | 11.6 | 0.13 | 1.27 |
| M | ISRAEL | . | . | 2.24 | 1.84 | . | 19.8 | . | . | . | . | . | . | 3.93 | . | . | . |
| M | FRANCE | 2.43 | 2.15 | 9.95 | 7.59 | 6.69 | 12.8 | . | 1.47 | 15.0 | 13.2 | 2.56 | . | 1.08 | 1.88 | 0.01 | . |
| M | SINGAPORE | . | . | . | . | 0.78 | . | . | . | . | . | . | . | 1.39 | 1.24 | 0.00 | . |
| M | SWITZERLAND | 0.80 | . | 1.04 | . | 0.51 | . | . | . | 14.0 | 1.48 | . | 2.27 | . | . | . | . |
| M | NETHERLANDS | . | 1.25 | 2.01 | . | . | 0.06 | 3.42 | 10.1 | 1.56 | . | 1.67 | . | 2.17 | . | 0.25 | 0.00 |
| M | HUNGARY | . | . | . | . | . | . | . | . | . | . | . | . | . | 1.42 | 0.00 | . |
| M | CZECH REPUBLIC | . | . | . | . | . | . | . | . | . | . | . | . | . | 0.91 | . | 0.31 |
| M | AUSTRIA | 222.7 | 32.6 | 12.0 | 2.00 | . | . | 4.61 | . | . | 14.3 | . | . | . | . | . | . |
| M | BELGIUM | . | . | . | . | 4.97 | . | . | . | . | . | . | . | . | . | . | . |
| M | BRAZIL | . | 3.18 | 0.86 | 14.1 | . | . | 2.60 | . | . | . | . | . | . | . | . | . |
| M | COSTA RICA | . | . | . | . | . | . | . | . | . | . | . | . | . | . | 0.02 | . |
| M | DENMARK | . | . | . | 2.02 | . | . | . | 0.35 | . | . | . | . | . | . | 0.00 | 1.20 |
| M | IRELAND | 6.58 | . | 23.6 | 26.9 | 14.2 | 2.37 | 22.0 | 3.71 | . | 3.09 | . | . | . | . | 0.00 | . |
| M | NORWAY | . | . | . | . | . | . | . | . | . | . | 0.99 | . | . | . | 0.01 | . |
| M | PAKISTAN | . | . | . | . | . | . | . | . | . | . | . | . | . | . | 0.03 | . |
| M | ROMANIA | . | . | . | . | . | . | . | . | . | . | . | . | . | . | 1.82 | . |
| M | SPAIN | . | . | . | . | . | . | 0.36 | . | 0.13 | . | . | . | . | . | . | 0.02 |
| M | SWEDEN | . | 0.89 | . | . | . | . | . | . | . | . | . | . | . | . | 0.46 | . |
| M | THAILAND | . | . | . | . | . | . | . | . | 16.0 | . | . | . | . | . | . | . |
| M | UNITED STATES | . | . | . | . | . | . | . | . | . | . | . | . | . | . | 2.72 | 0.01 |
| SOURCE: US Department of Commerce, Import Administration |
| Table last modified on: September 23, 2008, with |
| Licensing data collected through September 23, 2008 and |
| Preliminary Census data compiled through August 2008 |
| Data listed in order of descending volume imported during last THREE months of Census data, including peliminary data |
| Steel mill categories are defined by 10-digit HTS codes |
| To see License Data at HTS 6-digit level click on chart title at the top of the page. |
| Link to Annual Summary of Census Data |
| Link to Summary Level of Monthly Census Data |