| US Imports of Steel Mill Products | |||
| FOR Line Pipe -- C & A |
|||
| Quantity in Metric Tons | |||
| Same Table - US Dollars |
Same Table - Average Unit Value |
||
| 'C & A' = Carbon and Alloy products, 'S' = Stainless products | |||
| Graph | Country | Census Data | License Data | |||||||||||||
|---|---|---|---|---|---|---|---|---|---|---|---|---|---|---|---|---|
| JUL07 | AUG07 | SEP07 | OCT07 | NOV07 | DEC07 | JAN08 | FEB08 | MAR08 | APR08 | MAY08 | JUN08 | JUL08 | AUG08 | SEP08 | ||
| M | WORLD | 263,146 | 204,477 | 198,356 | 250,407 | 277,497 | 196,646 | 277,392 | 263,219 | 248,313 | 255,591 | 244,650 | 257,202 | 255,925 | 179,552 | 126,091 |
| M | INDIA | 16,772 | 33,870 | 45,436 | 52,690 | 53,410 | 24,982 | 60,472 | 66,822 | 55,728 | 62,088 | 43,812 | 31,325 | 40,303 | 25,868 | 28,858 |
| M | CHINA | 36,456 | 27,142 | 38,381 | 26,735 | 49,143 | 14,282 | 44,108 | 37,287 | 21,995 | 23,312 | 31,988 | 43,557 | 31,755 | 42,198 | 30,141 |
| M | CANADA | 49,220 | 24,450 | 23,832 | 21,369 | 47,708 | 39,102 | 35,198 | 33,046 | 55,239 | 40,029 | 35,865 | 30,939 | 11,979 | 2,778 | 1,125 |
| M | ITALY | 28,896 | 11,899 | 22,706 | 20,542 | 18,005 | 24,041 | 15,876 | 35,921 | 39,138 | 2,457 | 37,063 | 22,552 | 16,415 | 7,049 | 4,965 |
| M | KOREA | 31,171 | 13,926 | 25,731 | 24,641 | 16,256 | 18,881 | 36,839 | 16,704 | 18,494 | 32,380 | 18,176 | 16,796 | 36,417 | 33,741 | 10,915 |
| M | GERMANY | 17,358 | 17,862 | 9,895 | 18,772 | 23,808 | 7,530 | 19,312 | 22,496 | 4,680 | 38,359 | 15,104 | 13,610 | 25,056 | 9,986 | 8,997 |
| M | MEXICO | 3,510 | 6,158 | 6,303 | 7,554 | 6,039 | 5,175 | 9,395 | 11,001 | 12,592 | 12,493 | 16,489 | 17,188 | 18,479 | 15,815 | 5,391 |
| M | GREECE | 23,596 | 23,308 | 11,069 | 22,761 | 13,958 | 22,836 | 20,666 | 21,512 | . | . | 16,422 | 24,259 | 10,133 | . | . |
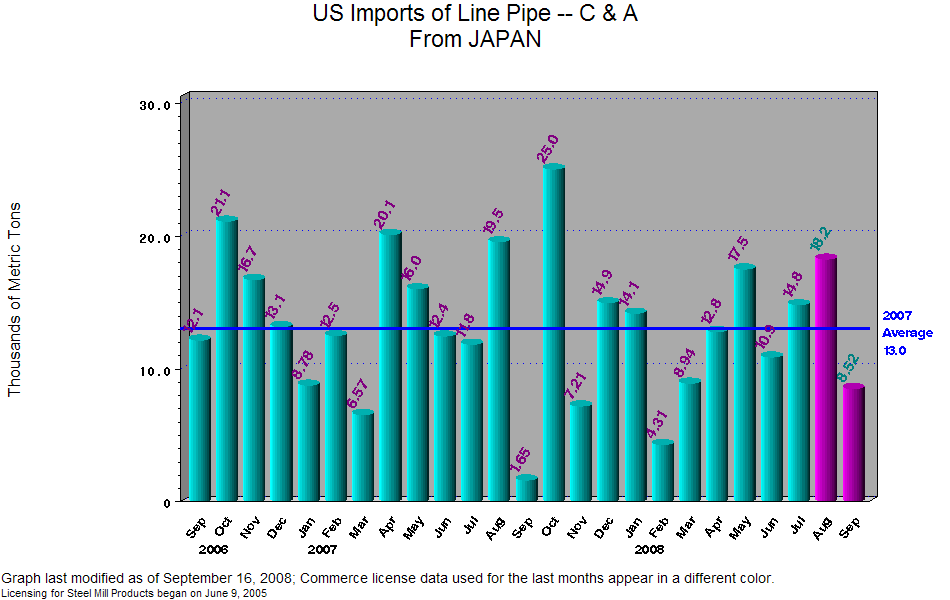
| M | JAPAN | 11,870 | 19,580 | 1,652 | 25,063 | 7,218 | 14,988 | 14,197 | 4,317 | 8,941 | 12,808 | 17,528 | 10,911 | 14,837 | 18,280 | 8,529 |
| M | TURKEY | . | . | . | . | . | . | . | 3,224 | . | . | . | 10,888 | 10,317 | 6,722 | 9,892 |
| M | UKRAINE | 295.2 | 96.1 | 81.7 | 1,845 | 61.8 | 41.1 | 5,509 | . | 4,701 | 5,011 | 86.6 | 8,415 | 9,452 | 6,744 | 842.9 |
| M | TAIWAN | 1,561 | 2,358 | 5,071 | 2,163 | 1,964 | 1,666 | 2,310 | 863.5 | 2,662 | 2,909 | 1,075 | 4,766 | 3,093 | 2,817 | 3,112 |
| M | CZECH REPUBLIC | 7,938 | 962.2 | 2,616 | 505.5 | 124.8 | 2,691 | 2,137 | 14.6 | 7,188 | 3,689 | 2,187 | 3,499 | 2,791 | 2,864 | 2,737 |
| M | RUSSIA | 4,619 | 1,884 | . | 5,356 | . | . | 521.2 | . | 1,897 | 3,495 | . | . | 7,241 | . | 504.6 |
| M | BRAZIL | 3,506 | 1,306 | 227.6 | 494.7 | 269.6 | 3.17 | 1,116 | 1,111 | 2,099 | 4,205 | 737.7 | 4,842 | 1,442 | 624.7 | . |
| M | FRANCE | 129.2 | 367.1 | 52.9 | 380.1 | 550.2 | 335.8 | 428.2 | 262.3 | 1,140 | 3,791 | 2,196 | 3,024 | 1,789 | 1,176 | 219.8 |
| M | ARGENTINA | 4,044 | . | 4,173 | 6,597 | 9,641 | 149.5 | 27.1 | 4,349 | 199.2 | 4,093 | 2,949 | 683.5 | 2,828 | 1,604 | 2,132 |
| M | ROMANIA | 4,807 | . | 9.84 | 3,713 | 3,642 | . | 2,327 | 561.2 | 6,479 | 1,684 | . | 2,823 | 3,329 | . | 1,953 |
| M | AUSTRIA | . | 0.13 | . | . | 1,324 | 464.2 | 766.4 | 504.1 | 660.8 | . | 1,314 | 655.3 | 2,624 | 38.2 | 37.6 |
| M | POLAND | 2,717 | 218.3 | 174.6 | 183.9 | 400.4 | 194.6 | 367.0 | . | 112.7 | 341.8 | 757.4 | 1,854 | 926.4 | . | 518.2 |
| M | UNITED KINGDOM | 9,619 | 17,521 | 66.8 | 7,671 | 18,237 | 18,615 | 2,549 | 380.7 | 110.6 | 214.3 | 327.9 | 3,174 | . | 0.11 | 329.4 |
| M | SOUTH AFRICA | 1,404 | 748.8 | 437.8 | . | 833.7 | 412.6 | 2,358 | . | 3,087 | 2,002 | . | 314.6 | 2,128 | . | . |
| M | SPAIN | . | 137.1 | . | . | 101.1 | 4.90 | . | . | . | . | 8.23 | 474.3 | 1,269 | 839.1 | . |
| M | THAILAND | . | . | . | . | . | . | . | 2,736 | 692.4 | . | 173.7 | 291.8 | 482.4 | 232.0 | 358.6 |
| M | SLOVAKIA | 468.0 | 337.3 | 413.2 | . | 307.4 | 245.7 | 746.4 | 47.4 | 108.0 | 60.1 | 168.0 | 181.0 | 412.6 | 21.1 | 485.1 |
| M | VENEZUELA | 3,133 | 254.3 | . | 1,363 | 4,489 | . | 150.4 | . | 352.4 | 123.0 | 202.8 | . | 403.9 | . | . |
| M | NETHERLANDS | . | 9.95 | 0.43 | . | . | . | . | . | 0.25 | . | . | 169.2 | 10.6 | . | . |
| M | SINGAPORE | . | . | . | . | . | . | . | . | 8.55 | 16.2 | 12.5 | . | . | . | . |
| M | GUATEMALA | . | . | . | . | . | . | . | . | . | . | . | . | 1.76 | . | . |
| M | BELGIUM | . | . | 20.1 | . | . | . | . | . | . | . | . | . | . | . | . |
| M | CHILE | . | . | . | . | . | . | . | . | . | . | . | . | . | 0.01 | . |
| M | CROATIA | . | . | . | . | . | . | . | . | . | . | . | . | . | . | 3,278 |
| M | HONG KONG | 19.8 | 58.9 | . | . | . | . | . | . | . | . | . | . | . | 79.1 | 757.2 |
| M | ISRAEL | . | . | . | . | . | . | . | 44.4 | . | . | . | . | . | . | . |
| M | KAZAKHSTAN | . | . | . | . | . | . | . | . | . | . | . | . | . | 0.56 | . |
| M | SWEDEN | 28.2 | . | . | . | . | . | 7.89 | 8.61 | . | 23.5 | . | . | . | . | . |
| M | SWITZERLAND | . | 17.0 | . | . | . | . | . | . | . | . | . | . | . | . | . |
| M | UNITED STATES | . | . | . | . | . | . | . | . | . | . | . | . | . | 68.5 | 4.96 |
| SOURCE: US Department of Commerce, Import Administration |
| Table last modified on: September 11, 2008, with |
| Licensing data collected through September 11, 2008 and |
| Final Census data compiled through July 2008 |
| Data listed in order of descending volume imported during last THREE months of census data,including preliminary data |
| Steel mill categories are defined by 10-digit HTS codes |
| To see License Data at HTS 6-digit level click on chart title at the top of the page. |
| Link to Annual Summary of Census Data |
| Link to Summary Level of Monthly Census Data |