 |
 |

|
Print  Download Reader
|
|
|
Print Download Reader
|
U.S. Department of Health and Human Services |
||
|---|---|---|
9/30/2005 |
9/30/2004 |
|
Assets (Note 2) |
||
Intragovernmental |
||
Fund Balance with Treasury (Note 3) |
$ 99,638 |
$ 97,667 |
Investments, Net (Note 5) |
300,664 |
287,886 |
Accounts Receivable, Net (Note 6) |
738 |
573 |
Anticipated Congressional Appropriations (Note 7) |
14,272 |
9,248 |
Other (Note 11) |
169 |
386 |
Total Intragovernmental |
$ 415,481 |
$ 395,760 |
Accounts Receivable, Net (Note 6) |
2,103 |
2,052 |
Loans Receivable and Foreclosed Property, Net (Note 8) |
379 |
390 |
Cash and Other Monetary Assets (Note 4) |
204 |
460 |
Inventory and Related Property, Net (Note 9) |
1,614 |
1,027 |
General Property, Plant & Equipment, Net (Note 10) |
4,557 |
3,877 |
Other (Note 11) |
4,149 |
185 |
Total Assets |
$ 428,487 |
$ 403,751 |
Liabilities (Note 12) |
||
Intragovernmental |
||
Accounts Payable |
$ 365 |
$ 652 |
Accrued Payroll and Benefits |
69 |
64 |
Other (Note 16) |
992 |
785 |
Total Intragovernmental |
$ 1,426 |
$ 1,501 |
Accounts Payable |
732 |
759 |
Entitlement Benefits Due and Payable (Note 13) |
53,754 |
49,229 |
Accrued Grant Liability (Note 15) |
3,783 |
3,755 |
Loan Guarantees Liabilities (Note 8) |
158 |
191 |
Federal Employee & Veterans Benefits (Note 14) |
7,183 |
7,178 |
Accrued Payroll & Benefits |
785 |
789 |
Other (Note 16) |
3,138 |
3,416 |
Total Liabilities |
$ 70,959 |
$ 66,818 |
Net Position |
||
Unexpended Appropriations |
87,350 |
82,052 |
Cumulative Results of Operations |
270,178 |
254,881 |
Total Net Position |
$ 357,528 |
$ 336,933 |
Total Liabilities & Net Position |
$ 428,487 |
$ 403,751 |
The accompanying “Notes to the Principal Financial Statements” are an integral part of these statements.
|
U. S. Department of Health and Human Services |
|||
|---|---|---|---|
9/30/2005 |
9/30/2004 |
||
Responsibility Segments |
|||
Administration for Children & Families (ACF) |
$ 46,722 |
$ 45,969 |
|
Administration on Aging (AoA) |
1,400 |
1,336 |
|
Agency for Healthcare Research & Quality (AHRQ) |
(297) |
(158) |
|
Centers for Disease Control & Prevention (CDC) |
5,242 |
5,114 |
|
Centers for Medicare & Medicaid Services (CMS) |
483,645 |
451,647 |
|
Food & Drug Administration (FDA) |
1,449 |
1,510 |
|
Health Resources & Services Administration (HRSA) |
6,787 |
7,007 |
|
Indian Health Service (IHS) |
3,157 |
3,362 |
|
National Institutes of Health (NIH) |
27,875 |
26,167 |
|
Office of the Secretary (OS) |
2,159 |
1,867 |
|
Program Support Center (PSC) |
(18) |
282 |
|
Substance Abuse & Mental Health Services Administration (SAMHSA) |
3,199 |
3,117 |
|
Net Cost of Operations |
$ 581,320 |
$ 547,220 |
|
The accompanying “Notes to the Principal Financial Statements” are an integral part of these statements.
|
U.S. Department of Health and Human Services |
||||
|---|---|---|---|---|
9/30/2005 |
9/30/2004 |
|||
Cumulative Results of Operations |
Unexpended Appropriations |
Cumulative Results of Operations |
Unexpended Appropriations |
|
Beginning Balances |
$ 254,881 |
$ 82,052 |
$ 250,734 |
$ 75,385 |
Adjustments (+/-) (Note 20) |
||||
Correction of Errors (+/-) |
178 |
(210) |
123 |
281 |
Beginning balances, as adjusted |
$ 255,059 |
$ 81,842 |
$ 250,857 |
$ 75,666 |
Budgetary Financing Sources: |
||||
Appropriations received |
- |
420,644 |
- |
392,109 |
Appropriations transferred-in/out (+/-) |
- |
241 |
- |
479 |
Other adjustments (rescissions, etc) (+/-) |
(5) |
(5,004) |
(40) |
(5,363) |
Appropriations used |
410,373 |
(410,373) |
380,839 |
(380,839) |
Nonexchange revenue |
186,136 |
- |
170,573 |
- |
Donations and forfeitures of cash and cash equivalents |
56 |
- |
41 |
- |
Transfers-in/out without reimbursement (+/-) |
(418) |
- |
(1,185) |
- |
Other Financing Sources: |
||||
Donations and forfeitures of property |
3 |
- |
3 |
- |
Transfers-in/out without reimbursement (+/-) |
(46) |
- |
665 |
- |
Imputed financing from costs absorbed by others |
342 |
- |
339 |
- |
Other (+/-) |
(2) |
- |
9 |
- |
Total Financing Sources |
$ 596,439 |
$ 5,508 |
$ 551,244 |
$ 6,386 |
Net Cost of Operations (+/-) |
581,320 |
- |
547,220 |
- |
Net Change |
15,119 |
5,508 |
4,024 |
6,386 |
Ending Balances |
$ 270,178 |
$ 87,350 |
$ 254,881 |
$ 82,052 |
The accompanying “Notes to the Principal Financial Statements” are an integral part of these statements.
|
U.S. Department of Health and Human Services |
||||
|---|---|---|---|---|
9/30/2005 |
9/30/2004 |
|||
Budgetary |
Non-Budgetary Credit Program Financing Accounts |
Budgetary |
Non-Budgetary Credit Program Financing Accounts |
|
Budgetary Resources: |
||||
Budget Authority |
||||
Appropriations Received |
$ 773,208 |
$ - |
$ 700,102 |
$ - |
Net transfers (+/-) |
(77) |
- |
498 |
- |
Other |
(1) |
- |
1 |
1 |
Unobligated Balances - Beginning of Period |
||||
Beginning of Period |
18,908 |
253 |
7,502 |
281 |
Net transfers, actual (+/-) |
(9) |
- |
(19) |
- |
Spending Authority from Offsetting Collections |
||||
Collected |
6,806 |
27 |
5,492 |
48 |
Receivable from Federal sources |
204 |
- |
130 |
- |
Change in unfilled customer orders |
||||
Advance received |
1 |
- |
(29) |
- |
Without advance from Federal sources |
1,160 |
- |
775 |
- |
Transfers from trust funds |
2,945 |
- |
3,758 |
- |
Subtotal |
$ 11,116 |
$ 27 |
$ 10,126 |
$ 48 |
Recoveries of prior year obligations |
||||
Actual |
11,672 |
- |
9,733 |
- |
Temporarily not available pursuant to Public Law |
(11,470) |
- |
(4,208) |
- |
Permanently not available (-) |
(9,785) |
- |
(2,981) |
- |
| Total Budgetary Resources | $ 793,562 |
$ 280 |
$ 720,754 |
$ 330 |
Status of Budgetary Resources: |
||||
Obligations Incurred |
||||
Direct |
$ 768,771 |
$ - |
$ 696,655 |
$ - |
Reimbursable |
6,790 |
74 |
5,355 |
77 |
Subtotal |
$ 775,561 |
$ 74 |
$ 702,010 |
$ 77 |
Unobligated Balances - Available |
||||
Apportioned |
12,078 |
206 |
13,049 |
73 |
Exempt from apportionment |
78 |
- |
98 |
- |
Unobligated Balances - Not Available |
5,845 |
- |
5,597 |
180 |
Total Status of Budgetary Resources |
$ 793,562 |
$ 280 |
$ 720,754 |
$ 330 |
Relationship of Obligations to Outlays: |
||||
Obligated Balance, Net - Beginning of Period |
$ 113,568 |
$ - |
$ 112,231 |
$ (23) |
Obligated Balance Transferred, Net (+/-) |
- |
- |
476 |
- |
Obligated Balance, Net - End of Period |
||||
Accounts receivable (-) |
(2,185) |
- |
(2,177) |
- |
Unfilled customer orders from Federal sources (-) |
(3,515) |
- |
(2,356) |
- |
Undelivered orders |
74,329 |
- |
73,442 |
- |
Accounts payable |
49,439 |
- |
44,660 |
- |
Disbursements |
757,988 |
74 |
690,226 |
54 |
Collections (-) |
(9,715) |
(27) |
(8,937) |
(48) |
Subtotal |
$ 748,273 |
$ 47 |
$ 681,289 |
$ 6 |
Less: Offsetting receipts |
166,971 |
55 |
137,771 |
49 |
| Net Outlays | $ 581,302 |
$(8) |
$ 543,518 |
$ (43) |
The accompanying “Notes to the Principal Financial Statements” are an integral part of these statements.
|
U.S. Department of Health and Human Services |
||
|---|---|---|
9/30/2005 |
9/30/2004 |
|
RESOURCES USED TO FINANCE ACTIVITIES: |
||
Budgetary Resources Obligated |
||
Obligations Incurred |
$775,635 |
$702,087 |
Less: Spending Authority from Offsetting Collections and Recoveries |
22,815 |
19,907 |
Obligations Net of Offsetting Collections and Recoveries |
$752,820 |
$682,180 |
Less: Offsetting Receipts |
167,026 |
137,820 |
Net Obligations |
$585,794 |
$544,360 |
Non-Budgetary Resources |
||
Donations and Forfeitures of Property |
$3 |
$3 |
Non-Budgetary Transfers in/out Without Reimbursement |
(46) |
665 |
Imputed Financing From Costs Absorbed by Others |
342 |
339 |
Other Non-Budgetary Resources |
(2) |
9 |
Net Non-Budgetary Resources Used to Finance Activities |
$297 |
$1,016 |
Total Resources Used to Finance Activities |
$586,091 |
$545,376 |
RESOURCES USED TO FINANCE ITEMS NOT PART OF THE NET COST OF OPERATIONS: |
||
Change in Budgetary Resources Obligated for Goods, Services and Benefits Ordered but Not Yet Provided |
$4,092 |
$1,060 |
Resources That Fund Expenses Recognized in Prior Periods |
15,802 |
12,373 |
Budgetary Offsetting Collections and Receipts That Do Not Affect Net Cost of Operations: |
||
Credit Program Collections That Increase Liabilities for Loans Guarantees or Allowances for Subsidy |
24 |
(48) |
Other |
(241) |
(184) |
Resources That Finance the Acquisition of Assets or Liquidations of Liabilities |
1,540 |
1,774 |
Other Resources or Adjustments to Net Obligated Resources That Do Not Affect Net Cost of Operations |
(1,232) |
2,383 |
Total Resources Used to Finance Items Not Part of the Net Cost of Operations |
$19,985 |
$17,358 |
Total Resources Used to Finance the Net Cost of Operations |
$566,106 |
$528,018 |
COMPONENTS OF NET COST OF OPERATIONS THAT WILL NOT REQUIRE OR GENERATE RESOURCES IN THE CURRENT PERIOD |
||
Components Requiring or Generating Resources in Future Periods: |
||
Increase in Annual Leave Liability |
$31 |
$8 |
Increase in Environmental and Disposal Liability |
2 |
- |
Upward/downward Reestimates of Credit Subsidy Expense |
(40) |
(87) |
Increase in Exchange Revenue Receivable from the Public |
679 |
2,476 |
Other |
(219) |
2,359 |
Liability for Unmatched SMI Premium (CMS only) (Note 7) |
5,173 |
5,645 |
Accrued Entitlement Benefit Costs (CMS only) |
9,470 |
10,039 |
Total Components of Net Cost of Operations That Will Require or Generate Resources in Future Periods |
$15,096 |
$20,440 |
Components Not Requiring or Generating Resources: |
||
Depreciation and Amortization |
$218 |
$108 |
Losses or (Gains) from Revaluation of Assets and Liabilities |
11 |
6 |
Other |
(111) |
(1,352) |
Total Components of Net Cost of Operations That Will Not Require or Generate Resources |
$118 |
$(1,238) |
Total Components of Net Cost of Operations That Will Not Require or Generate Resources in the Current Period |
15,214 |
19,202 |
NET COST OF OPERATIONS |
$581,320 |
$547,220 |
The accompanying “Notes to the Principal Financial Statements” are an integral part of these statements.
Note 1. Summary of Significant Accounting Policies
Reporting Entity
The Department of Health and Human Services (HHS or Department) is a cabinet-level agency of the executive branch of the Federal Government. Its predecessor, the Department of Health, Education and Welfare (HEW), officially came into existence on April 11, 1953. In 1979, the Department of Education Organization Act of 1979 (Public Law 96-88) was signed into law, providing for a separate Department of Education. HEW officially became HHS on May 4, 1980. The Department is responsible for protecting the health of all Americans and providing essential human services.
Organization and Structure of HHS
HHS is comprised of 11 Operating Divisions (commonly referred to as OPDIVs) with diverse missions and programs. Each OPDIV is considered a responsibility segment representing a component of a reporting entity that is responsible for carrying out a mission, conducting a major line of activity, or producing one or a group of related products or services. The managers of the responsibility segments report to the entity’s top management directly, and its resources and results of operations can be clearly distinguished from those of other responsibility segments of the entity. The 12 responsibility segments are:
Even though it is part of the Office of the Secretary, the Program Support Center reports on its activity separately because its business activities encompass offering services to other OPDIVs and Federal agencies. The Agency for Toxic Substances and Disease Registry is combined with the Centers for Disease Control and Prevention for financial reporting purposes; therefore, these footnotes will refer to them as one responsibility segment.
Basis of Accounting and Presentation
The accompanying financial statements have been prepared to report the financial position and results of operations of the Department, pursuant to the requirements of the Chief Financial
Officers Act of 1990 (Public Law 101-576), as amended by the Reports Consolidation Act of 2000 (Public Law 106-531) and presented in accordance with the requirements contained in the Office of Management and Budget (OMB) Circular No., A-136 (Revised), Financial Reporting Requirements. These statements have been prepared from the Department’s financial records on an accrual basis in conformity with accounting principles generally accepted in the United States (GAAP). The GAAP for Federal entities are the standards prescribed by the Federal Accounting Standards Advisory Board (FASAB) and recognized by the American Institute of Certified Public Accountants (AICPA) as Federal GAAP. These statements are therefore different from financial reports prepared pursuant to other OMB directives that are primarily used to monitor and control HHS’ use of budgetary resources.
The financial statements consolidate the balances of about 140 appropriations and fund accounts, and a number of accounts used for suspense, collection of receipts, and general government functions. Transactions and balances among HHS OPDIVs have been eliminated in the presentation of the Consolidated Balance Sheet, Consolidated Statement of Net Cost, Consolidated Statement of Changes in Net Position, and the Consolidated Statement of Financing. The Combined Statement of Budgetary Resources (SBR) is presented on a combined basis. Supplemental information is accumulated from the OPDIV reports, regulatory reports, and other sources within HHS.
Transactions are recorded on an accrual and budgetary basis of accounting. Under the accrual method of accounting, revenues are recognized when earned, and expenses are recognized when incurred, without regard to receipt or payment of cash. Budgetary accounting principles, on the other hand, are designed to recognize the obligation of funds according to legal requirements, which in many cases is prior to the occurrence of an accrual-based transaction. The recognition of budgetary accounting transactions is essential for compliance with legal constraints and controls over the use of Federal funds. The Centers for Medicare & Medicaid Services (CMS) uses the cash basis of accounting in the Medicare program to record benefit payments disbursed during the fiscal year, supplemented by the accrual method to estimate the value of benefit payments incurred but not yet paid as of the fiscal year-end. CMS also uses the cash basis of accounting in the Medicaid and the State Children’s Health Insurance Program (SCHIP) to record funds paid to the states during the fiscal year, supplemented by the accrual method to estimate the value of expenses (net of recoveries) not yet reported to CMS as of the end of the fiscal year. A number of other HHS OPDIVs also use the cash basis of accounting for some programs with an accrual adjustment made by recording year-end estimates of unpaid liabilities.
Unified Financial Management System
HHS has taken a step in streamlining and integrating its financial management systems with the implementation of the Unified Financial Management System (UFMS). HHS’ overarching
financial management goals seek to (1) provide decision makers with timely, accurate, and useful financial and program information; and (2) ensure that HHS resources are used appropriately, efficiently, and effectively. With UFMS, HHS will also standardize business processes for all core functions including general ledger, accounts payable, accounts receivable, cost management, budget execution, and financial reporting. UFMS went live with the Centers for Disease Control and Prevention (CDC) and the Food and Drug Administration (FDA) in April 2005 for core financials, including general ledger, accounts payable, and accounts receivable; and in addition, Projects for CDC and iProcurement for FDA.
Transition of Payroll System to Defense Finance and Accounting Service
HHS has completed its payroll conversion for civilian payroll, except for Public Health Service Commissioned Corps, from the HHS legacy payroll system to the Defense Finance and Accounting Service (DFAS) on April 17, 2005. HHS is the single largest civilian agency payroll conversion ever completed by the DFAS.
The DFAS offers an array of multi-functional payroll processing applications and services, in compliance with existing Joint Financial Management Improvement Program SR-99-5, Human Resources & Payroll Systems Requirements for payroll management activities. These include:
Use of Estimates in Preparing Financial Statements
Preparation of financial statements in accordance with accounting principles generally accepted in the U.S. requires management to make estimates and assumptions that affect the reported amounts of assets and liabilities and disclosure of contingent liabilities as of the date of the financial statements. Estimates and assumptions also affect the revenues and expenses accrued and reported in the financial statements. Actual results may differ from those estimates.
Entity and Non-Entity Assets
Entity assets are assets that the reporting entity has authority to use in its operations. The authority to use funds in an entity’s operations means entity management has the authority to decide how funds are used, or management is legally obligated to use funds to meet entity obligations.
Non-entity assets are those assets that are held by the reporting entity, but are not available for use by the entity. An example of a non-entity asset is the interest accrued on overpayments and cost settlements reported by the Medicare contractors.
The HHS financial statements do not report entity and non-entity assets separately on the face of the statement. Instead, such detail is presented in Note 2, Non-Entity Assets.
Fund Balance with Treasury
The Department maintains its available funds with the Department of the Treasury (Treasury) except for the Medicare Benefit accounts maintained at commercial banks - see Note 4, Cash and Other Monetary Assets. The Fund Balance with Treasury is available to pay current liabilities and finance authorized purchases. Cash receipts and disbursements are processed by Treasury, and
HHS’ records are reconciled with those of Treasury on a regular basis. Note 3, Fund Balance with Treasury, provides additional information.
Investments
Investments consist of U.S. Treasury securities including the CMS Par Value securities carried at face value, and other securities carried at amortized cost. Federal law requires that trust fund balances that are not necessary to meet current expenditures be invested in interest-bearing obligations of the U.S. Government or in obligations guaranteed as to both principal and interest by the U.S. Government. No provision is made for unrealized gains or losses on these securities since it is the Department’s intent to hold investments to maturity. Interest income is compounded semiannually in June and December and is adjusted to include an accrual for interest earned from July 1 to September 30.
Note 5, Investments, Net, provides additional information on investments.
Accounts Receivable, Net
Accounts receivable consists of the amounts owed to HHS by other Federal agencies and the public as the result of the provision of goods and services. Intragovernmental accounts receivable arise generally from the provision of reimbursable work to other Federal agencies and no allowance for uncollectible accounts is established as they are considered to be fully collectible. Accounts receivable also includes interest due to HHS that is directly attributable to delinquent accounts receivable.
Accounts receivable from the public typically result from overpayments to Medicare providers and beneficiaries, amounts due from cost disallowance for Medicaid, and amounts due from organizations for civil monetary penalties not yet remitted to the Department of Justice. They are presented net of an allowance for uncollectible accounts. The allowance for uncollectible accounts is determined based on past collection experience and an analysis of outstanding balances.
Note 6, Accounts Receivable, Net, provides additional information on accounts receivable.
Loan Guarantee Receivables and Liabilities
HHS administers guaranteed loan programs for the Health Center and the Health Education Assistance Loans (HEAL) programs. Loans receivables represent defaulted guaranteed loans
which have been paid to lenders under this program. Loans receivable also include interest due to HHS on the defaulted loans. Loans guarantee liabilities are valued at the present value of the cash outflows from HHS less the present value of related inflows.
As required under the Federal Credit Reform Act of 1990 (FCRA), for loan guarantees committed on or after October 1, 1991, guaranteed loans are reduced by an allowance for subsidy representing the present value of the amounts not expected to be recovered and thus having to be subsidized by the government for loan guarantees. The FCRA also requires that the subsidy cost estimate be based on the net present value of the specified cash flows discounted at the interest rate of marketable Treasury securities of similar maturities. The liability for loan guarantees committed on or after October 1, 1991 is reported at present value.
For loan guarantees committed prior to October 1, 1991, loan guarantee principal and interest receivable are reduced by an allowance for estimated uncollectible amounts. The allowance is estimated based on past experience and an analysis of outstanding balances. The liability for loan guarantees committed prior to October 1, 1991 is established based upon an average default rate. The liability is adjusted each year for the change in default rates.
Note 8, Loan Guarantee Receivables and Liabilities, provides additional information.
Advances to Grantees/Accrued Grant Liability
HHS awards grants to various grantees and provides advance payments to grantees to meet their cash needs to carry out their programs. Advance payments are recorded as “Advances to Grantees” and are liquidated upon grantees’ reporting expenditures. Grantees sometime incur expenditures before drawing down funds that, when claimed, would reduce the “Advances to Grantees” account. An accrued grant liability occurs when the accrued grant expenses exceed the outstanding advances to grantees, resulting in a negative balance in the “Advances to Grantees” account. HHS grants are classified into two categories: “Grants Not Subject to Grant Expense Accrual” and “Grants Subject to Grant Expense Accrual.” Progress payments on work in process are not included in grants.
Grants Not Subject to Grant Expense Accrual: These grants represent formula grants (also referred to as “block grants”) under which grantees provide a variety of services or payments to individuals and local agencies. Expenses are recorded as the grantees draw funds. These grants are funded on an allocation basis determined by budgets and agreements approved by the sponsoring OPDIV as opposed to a reimbursable basis. Therefore, they are not subject to grant expense accrual.
Grants Subject to Grant Expense Accrual: For grants subject to grant expense accrual (commonly referred to as “non-block grants”), grantees draw funds (recorded as Advances to Grantees in HHS’ accounting systems) based on their estimated cash needs. As grantees report their actual disbursements (quarterly), the amounts are recorded as expense, and the advance balance is
reduced. At year-end, the OPDIVs report both actual payments made through the third quarter and an unreported grant expenditures estimate for the fourth quarter based on historical spending patterns of the grantees. The year-end accrual estimate equals the estimate of fourth quarter disbursements plus an average of two weeks annual expenditures for expenses incurred prior to the cash being draw down.
Exceptions to the definition of “block” or “non-block” grants for reporting purposes are the Temporary Assistance for Needy Families program and the Child Care Development Fund program. These two programs are referred to as “block” grants but since the programs report expenses to HHS, they are treated as “non-block” grants for the estimate of the grant accrual.
HHS reports advances other than grant advances in Note 11, Other Assets. Note 15, Accrued Grant Liability, provides additional information on the accrued grant liability.
Inventory and Related Property, Net
Inventory and Related Property primarily consists of Inventory Held for Sale, Operating Materials and Supplies, and Stockpile Materials.
Inventory Held for Sale consists of small equipment and supplies held by Service and Supply Funds for sale to HHS components and other Federal entities. Inventories held for sale are valued at historical cost using the first-in first-out (FIFO) cost flow assumption with the exception of the National Institutes of Health, which uses the moving average cost flow assumption method.
Operating Materials and Supplies consist of pharmaceuticals, biological products, and other medical supplies used in providing medical services and conducting medical research. Operating materials and supplies are recorded as assets when purchased, and are expensed when they are consumed. Operating materials and supplies are valued at historical cost using the
FIFO cost flow assumption.
As required by the Project BioShield Act of 2004, the Department of Homeland Security transferred Strategic National Stockpile materials to HHS in FY 2004. These materials are held in reserve to respond to local and national emergencies. In addition, the Centers for Disease Control and Prevention (CDC) maintain a stockpile of vaccines to meet unanticipated needs in the cause of a national emergency. The CDC’s stockpile of vaccine materials are valued at historical cost using a specific identification cost flow assumption and the Strategic National Stockpile materials are valued at historical cost using First-In First-Out (FIFO) cost flow assumption.
Note 9, Inventory and Related Property, Net, provides additional information.
General Property, Plant and Equipment, Net
General Property, Plant and Equipment (PP&E) consists of buildings, structures, and facilities used for general operations; land acquired for general operating purposes; equipment; assets under
capital lease; leasehold improvements; construction-in-progress; and internal use software. The basis for recording purchased PP&E is full cost, which includes all costs incurred to bring the PP&E to a form and location suitable for its intended use. The cost of PP&E acquired under a capital lease is the amount recognized as a liability for the capital lease at its inception. The cost of PP&E acquired through donation is the estimated fair value when acquired. The cost of PP&E transferred from other Federal entities is the net book value of the transferring entity. All PP&E with an initial acquisition cost of $25,000 or more and an estimated useful life of two years or more are capitalized, except for internal use software discussed below.
PP&E is depreciated using the straight-line method over the estimated useful life of the asset. Land and land rights, including permanent improvements, are not depreciated. Normal maintenance and repair costs are expensed as incurred.
Statement of Federal Financial Accounting Standards (SFFAS) No. 10, Accounting for Internal Use Software, requires that the capitalization of internally-developed, contractor-developed, and commercial off-the-shelf (COTS) software begin in the software development phase. In FY 2004, HHS incurred development costs for the Unified Financial Management System (UFMS), a COTS software package, and began capitalizing the cost. In FY 2001 the CMS began the HIGLAS project to replace the Medicare contractors’ and CMS’ current accounting systems with a single, unified system. HIGLAS will eventually replace the different systems now in use by contractors that process and pay claims, in addition to CMS’ current mainframe-based administrative accounting financial system. The estimated useful life for internal use software was determined to be seven to ten years for amortization.
SFFAS No. 10 also requires that amortization begins when the asset is placed in use. In April 2005, UFMS was implemented at the Centers for Disease Control and Prevention and the Food and Drug Administration. In FY 2005, Centers for Medicare & Medicaid Services began amortizing the Healthcare Integrated General Ledger Accounting System (HIGLAS) over 10 years using the straight-line method in accordance with HHS policy for UFMS. In addition, CMS has other capitalized internal use software that are currently being amortized over a useful life of 5 years.
The capitalization threshold for internal use software costs for appropriated fund accounts is $1 million or more. The internal use software capitalization threshold for revolving funds is
$500,000. Costs below the threshold levels are expensed. The software is depreciated for a period of time consistent with the estimated useful life used for planning and acquisition purposes.
Additional information is provided in Note 10, General Property, Plant and Equipment, Net.
Liabilities
Liabilities are recognized for amounts of probable and measurable future outflows or other sacrifices of resources as a result of past transactions or events. Since HHS is a component of the
U.S. Government, a sovereign entity, its liabilities cannot be liquidated without legislation that provides resources to do so. Payments of all liabilities other than contracts can be abrogated by the sovereign entity. In accordance with public law and existing Federal accounting standards, no liability is recognized for future payments to be made on behalf of current workers contributing to the Medicare Health Insurance Trust Fund, since future Medicare benefits are not tied to prior Medicare contributions. The Department’s liabilities are classified as covered by budgetary resources or not covered by budgetary resources.
Liabilities Covered by Budgetary Resources:Liabilities funded by available budgetary resources include: (1) new budget authority, (2) spending authority from offsetting collections, (3) recoveries of expired budget authority, (4) unobligated balances of budgetary resources at the beginning of the year, and (5) permanent indefinite appropriation or borrowing authority.
Liabilities Not Covered by Budgetary Resources: Sometimes funding has not yet been made available through Congressional appropriations or current earnings. The major liabilities in this category include employee annual leave earned but not taken, and amounts billed by the Department of Labor (DOL) for Federal Employees’ Compensation Act (FECA) disability payments, and for portions of the Entitlement Benefits Due and Payable liability (discussed below) for which no obligations have been incurred. Also included in this category is the actuarial FECA liability determined by DOL but not yet billed. For HHS revolving funds, all liabilities are funded as they occur.
Liabilities Covered by Budgetary Resources and Liabilities Not Covered by Budgetary Resources are combined on the balance sheet. The breakout of these resources is presented in Note 12, Liabilities Not Covered by Budgetary Resources; Note 13, Entitlement Benefits Due and Payable; Note 14, Federal Employee and Veterans’ Benefits; and Note 16, Other Liabilities.
Accounts Payable
Accounts Payable primarily consists of amounts due for goods and services received, progress in contract performance, interest due on accounts payable, and other miscellaneous payables.
Accrued Payroll and Benefits
Accrued Payroll and Benefits consist of salaries, wages, leave and benefits earned by employees, but not disbursed as of September 30. Liability for annual and other vested compensatory leave is accrued when earned and reduced when taken. At the end of each fiscal year, the balance in the accrued annual leave liability account is adjusted to reflect current pay rates. Annual leave earned but not taken is considered an unfunded liability since this leave will be funded from future appropriations when it is actually taken by employees. Sick leave and other types of leave are not accrued and are expensed when taken.
Entitlement Benefits Due and Payable
Entitlement Benefits Due and Payable represent the liability for Medicare and Medicaid for medical services incurred but not reported as of the balance sheet date. The abbreviation IBNR is periodically used in these statements in place of “incurred but not reported.”
Medicare Incurred But Not Reported, or Medicare IBNR
The Medicare liability is developed by the Office of Actuary of the Centers for Medicare & Medicaid Services (CMS) and represents (1) an estimate of claims incurred, which may or may not have been submitted to the Medicare contractors, but which were not yet approved for payment, (2) actual claims that have been approved for payment by the Medicare contractors for which checks have not yet been issued, (3) checks that have been issued by the Medicare contractors in payment of a claim and that have not yet been cashed by payees, (4) periodic interim payments for services rendered in current fiscal year but paid in subsequent fiscal year, and (5) an estimate of
retroactive settlements of cost reports submitted to the Medicare contractors by health care providers.
Medicaid Incurred But Not Reported, or Medicaid IBNR
The Medicaid estimate represents the net of unreported expenses incurred by the states less amounts owed to the states for overpayment of Medicaid funds to providers, anticipated rebates from drug manufacturers, and settlements of probate and fraud and abuse cases. FY 2005 estimate was developed based on historical relationships between prior Medicaid net payables and current Medicaid activity.
Note 13, Entitlement Benefits Due and Payable, provides additional information.
Federal Employee and Veterans’ Benefits
Most HHS employees participate in either the Civil Service Retirement System (CSRS) - a defined benefit plan, or the Federal Employees Retirement System (FERS) - a defined benefit and contribution plan. For employees covered under CSRS, the Department contributes a fixed percentage of pay. Most employees hired after December 31, 1983 are automatically covered by FERS. For employees covered under FERS, the Department contributes the employer’s matching share for Social Security and Medicare Insurance. A primary feature of FERS is that it offers a Thrift Savings Plan (TSP) into which the Department automatically contributes one percent of employee pay and matches employee contributions up to an additional four percent of pay.
The U.S. Office of Personnel Management is the administering Agency for both of these benefit plans and, thus, reports CSRS or FERS assets, accumulated plan benefits, or unfunded liabilities applicable to Federal employees. Therefore, HHS does not recognize any liability on its balance sheet for pensions, other retirement benefits, and other post-employment benefits with the exception of Commission Corps (see below). HHS does, however, recognize an expense in the Consolidated Statement of Net Cost and imputed financing source for the annualized unfunded portion of pension and post-retirement benefits in the Consolidated Statement of Changes in Net Position.
HHS administers the Public Health Service (PHS) Commissioned Corps Retirement System, a defined noncontributory benefit plan, for its active duty officers and retiree annuitants or survivors.
The plan does not have accumulated assets, and funding is provided entirely on a pay as you go basis by Congressional appropriations. HHS records the actuarial liability based on the present value of accumulated pension plan benefits and the post-retirement health benefits.
The liability for Federal employee and veterans’ benefits also includes a liability for actual and estimated future payments for workers’ compensation pursuant to FECA. FECA provides income and medical cost protection (1) to Federal employees who were injured on the job or who have sustained a work-related occupational disease and (2) to beneficiaries of employees whose death is attributable to job-related injury or occupational disease. The FECA program is administered by the DOL, which pays valid claims and subsequently bills the employing Federal agency. The
FECA liability consists of two components - the actual claims paid by DOL but not yet disbursed, and the estimated liability for future benefit payments as a result of past events, such as death, disability, and medical costs.
Note 14, Federal Employee and Veterans’ Benefits, provides additional information.
Revenue and Financing Sources
The Department receives the majority of funding needed to support its programs through Congressional appropriation and through reimbursement for the provision of goods or services to other Federal agencies. The United States Constitution prescribes that no money may be expended by a Federal Agency unless and until funds have been made available by Congressional appropriation. Appropriations are recognized as financing sources when related expenses are incurred or assets are purchased. Revenues from reimbursable agreements are recognized when the goods or services are provided by the Department. Other financing sources, such as donations and transfers of assets without reimbursements, are also recognized on the consolidated statement of changes in net position.
Appropriations. The Department receives annual, multi-year, and no-year appropriations that may be used within statutory limits. For example, funds for general operations are generally made available for one fiscal year, funds for long-term projects such as major construction will be available for the expected life of the project, and funds used to establish revolving fund operations are generally available indefinitely (i.e., no year funds). The Statement of Budgetary Resources presents information about the resources appropriated to the Department.
Exchange and Non-Exchange Revenue. HHS classifies revenues as either exchange revenue or non-exchange revenue. Exchange revenues are recognized when earned, i.e., when goods have been delivered or services have been rendered. These revenues reduce the cost of operations borne by the taxpayer.
Non-exchange revenues result from donations to the government and from the government’s sovereign right to demand payment, including taxes. Non-exchange revenues are recognized when a specifically identifiable, legally enforceable claim to resources arises, but only to the extent that collection is probable and the amount is reasonably estimable. Non-exchange revenues are not considered to reduce the cost of the Department’s operations and are reported in the Statement of Changes in Net Position.
For periods after December 31, 1993, employees and employers are each required to contribute
1.45 percent of employee wages, and self-employed persons are required to contribute 2.90 percent of net income, with no limitation, to the Hospital Insurance (HI) trust fund. The Social Security Act requires the transfer of these contributions from the General Fund of Treasury to the HI trust fund based on the amount of wages certified by the Social Security Administration (SSA) from SSA records of wages established and maintained by SSA in accordance with wage information reports. The SSA uses the wage totals reported annually by employers via the quarterly Internal Revenue Service Form 941 as the basis for conducting quarterly certification of regular wages.
With minor exceptions, all receipts of revenues by Federal agencies are processed through Treasury’s central accounting system. Regardless of whether they derive from exchange or non-exchange transactions, all receipts that are not earmarked by Congressional appropriation for immediate departmental use are deposited in the general or special funds of the Treasury. Amounts not retained for use by HHS are reported as transfers to other government agencies on the HHS Statement of Changes in Net Position.
Imputed Financing Sources. In certain instances, operating costs of HHS are paid out of funds appropriated to other Federal agencies. For example, by law, certain costs of retirement programs are paid by the Office of Personnel Management, and certain legal judgments against HHS are paid from the Judgment Fund maintained by Treasury. When costs that are identifiable to HHS and directly attributable to the Department’s operations are paid by other agencies, the Department recognizes these amounts as imputed costs of HHS, and at the same time, this amount is recognized as an imputed financing source on the Consolidated Statement of Changes in Net Position.
Other Financing Sources. Medicare’s HI program, or Medicare Part A, is financed through the HI trust fund, whose revenues come primarily from the Medicare portion of payroll and from self-employment taxes collected under the Federal Insurance Contribution Act (FICA) and under the Self-Employment Contribution Act (SECA). The Medicare payroll tax rate is 2.9 percent of annual wages. Contribution rates are discussed under Exchange and Non-Exchange Revenue.
Medicare’s Supplemental Medical Insurance (SMI) program, or Medicare Part B, is financed primarily by general fund appropriations (Payments to the Health Care Trust Funds) provided by Congress and by monthly premiums paid by beneficiaries. Premium payments from Medicare beneficiaries are matched approximately three to one by Congressional appropriations.
Aggregate non-exchange revenues consist primarily of FICA taxes of $157,702 million and $142,659 million, SECA taxes of $11,252 million and $10,789 million, and Trust Fund investment interest of $16,484 million and $16,574 million for FY 2005 and FY 2004, respectively.
Contingencies
A loss contingency is an existing condition, situation, or set of circumstances involving uncertainty as to possible loss to the Department. The uncertainty should ultimately be resolved when one or more future events occur or fail to occur. The likelihood that the future event or events will confirm the loss or the incurrence of a liability can range from probable to remote. Statement of Federal Financial Accounting Standards (SFFAS) No. 5, Accounting for Liabilities of the Federal Government, as amended by SFFAS No. 12, Recognition of Contingent Liabilities from Litigation, contains the criteria for recognition and disclosure of contingent liabilities. With the exception of pending, threatened, or potential litigation, a contingent liability is recognized when a past transaction or event has occurred, a future outflow or other sacrifice of resources is more likely than not to occur, and the related future outflow or sacrifice of resources is measurable. For pending, threatened, or potential litigation, a liability is recognized when a past transaction or event has occurred, a future outflow or other sacrifice of resources is likely to occur, and the related future outflow or sacrifice of resources is measurable.
Note 23, Contingencies, provides additional information.
Reclassifications
Certain reclassifications were made to the presentation of the September 30, 2004 financial statements and footnotes to improve their comparability with September 30, 2005 statements and footnotes, in compliance with the form and content prescribed by the OMB Circular No. A-136, the effect of which is immaterial. The Prior Period Adjustments reported in FY 2004 have been reported as Adjustment, Correction of Errors in the FY 2005 Statement of Changes in Net Position. In addition, the Status of Fund Balance section of the Note 3, Fund Balance with Treasury from the prior year was reclassified based on the revised format in the OMB Circular No. A-136.
Reconciliation of FACTS II to the Statement of Budgetary Resources
Management recognizes that the Federal Agencies’ Centralized Trial-balance System II (FACTS II) submission of budgetary data does not agree with HHS’ Statement of Budgetary Resources as presented in the audited financial statements. There are many known recurring differences that contribute to the differences that are properly reported on the SBR and are appropriately not included in the FACTS II submission. Some of these reconciling items include: accounts payable adjustments, estimated Grantee Expenditure Reports (SF 272s) not yet received for the fourth quarter, estimated grantee expenses incurred but not reported, and certain intra-departmental transactions, such as Intra-Departmental Delegations of Authority.
Intragovernmental Relationships and Transactions
In the course of its operations, HHS has relationships and financial transactions with numerous Federal agencies. The more prominent of these are the Social Security Administration (SSA) and the Department of the Treasury. The SSA determines eligibility for Medicare programs and also allocates a portion of Social Security benefit payments to the Medicare Part B Trust Fund for Social Security beneficiaries who elect to enroll in the Medicare Part B program. The Treasury receives the cumulative excess of Medicare receipts and other financing over outlays and issues interest-bearing securities in exchange for the use of those monies. At the government-wide level, the assets related to the trust funds on HHS’ financial statements and the corresponding liabilities on the Treasury’s financial statements would be eliminated.
Medicare Hospital Insurance (HI) Trust Fund
Medicare contractors are paid by Centers for Medicare & Medicaid Services to process Medicare claims for hospital inpatient services, hospice, and certain skilled nursing and home health services. Benefit payments made by the Medicare contractors for these services as well as any related administrative costs are charged to the HI trust fund. The CMS payments to managed care plans are also charged to this fund. The financial statements include HI trust fund activities administered by the Treasury. This trust fund has permanent indefinite budgetary authority.
Medicare Supplementary Medical Insurance (SMI) Trust Fund
Medicare contractors are paid by CMS to process Medicare claims for physicians, medical suppliers, hospital outpatient services and rehabilitation, end-stage renal disease treatment providers, rural health clinics, and certain skilled nursing and home health services. Benefit payments made by the Medicare contractors for these services, as well as administrative costs, are charged to the SMI trust fund. The CMS payments to managed care plans are also charged to this fund. The financial statements include SMI trust fund activities administered by Treasury. This trust fund has permanent indefinite budgetary authority.
Medicare Prescription Drug Discount Card and Transitional Assistance
The Medicare Prescription Drug Discount Card and Transitional Assistance Program was enacted into law in December 2003 with passage of the Medicare Modernization Act of 2003 (MMA). The Drug Discount Card program enables Medicare beneficiaries to obtain discounts of 10 to 25 percent on prescription drugs.
Medicare Integrity Program (MIP)
The Health Insurance Portability and Accountability Act (Public Law 104-191) established the MIP and codified the program integrity activities previously known as “payment safeguards.” This account is also referred to as the Health Care Fraud and Abuse Control (HCFAC) program or simply “Fraud and Abuse.” To safeguard the Medicare system, the CMS contracts with eligible entities to perform such activities as medical and utilization reviews, fraud reviews, cost report audits, and the education of providers and beneficiaries with respect to payment integrity and benefit quality assurance issues. The MIP is funded by the HI trust fund.
Medicaid
Medicaid, the health care program for low-income Americans, is administered by CMS in partnership with the states. Grant awards limit the funds that can be drawn by the states to cover current expenses. The grant awards, which are prepared at the beginning of each quarter and are amended as necessary, are an estimate of the CMS share of states’ Medicaid costs. At the end of each quarter, states report their expenses (net of recoveries) for the quarter, and subsequent grant awards are issued by CMS for the difference between approved expenses reported for the period and grant awards previously issued.
Note 2. Non-Entity Assets
Non-entity assets at September 30, 2005 and 2004 consisted of the following:
(Dollars in Millions) |
2005 |
2004 |
|---|---|---|
Intragovernmental: |
||
Fund Balance with Treasury |
$ 23 |
$ 19 |
Accounts receivable |
- |
- |
Other |
- |
- |
Total Intragovernmental |
$ 23 |
$ 19 |
Accounts receivable |
$ 14 |
$ 24 |
Cash and other monetary assets |
- |
- |
Other |
- |
- |
Total non-entity assets |
$ 37 |
$ 43 |
Total entity assets |
428,450 |
403,708 |
Total Assets |
$ 428,487 |
$ 403,751 |
The $23 million non-entity asset Fund Balance with Treasury includes: $13 million of tax refunds collected by the Internal Revenue Service for past due child support payments that were transferred to HHS’ Administration for Children and Families for distribution to the states; $9 million in collections of royalties from licenses for which a portion is paid to inventors under the Federal Technology Transfer Act; and $1 million representing withholdings for state payroll deductions, collections of interest, and other miscellaneous receipts. The majority of the $14 million accounts receivable represents the interest accrued on overpayments as well as any cost settlements reported by the Medicare contractors.
The amount of unused funds that were transferred to Treasury due to cancelled appropriations or no longer available at the end of FY 2005 and FY 2004 were approximately $5.3 billion and $600 million, respectively.
Note 3. Fund Balance with Treasury
The Fund Balance with Treasury (FBWT) and the status of the fund balance at September 30, 2005 and 2004 are listed below by fund type.
(Dollars in Millions) |
2005 |
2004 |
||
|---|---|---|---|---|
Fund Balance with Treasury |
||||
Trust Funds |
$ 1,964 |
$ 2,753 |
||
Revolving Funds |
757 |
767 |
||
Appropriated Funds |
96,315 |
93,530 |
||
Other Funds |
602 |
617 |
||
Total |
$ 99,638 |
$ 97,667 |
||
Status of Fund Balance with Treasury |
||||
Unobligated Balance |
2005 |
2004 |
||
Available |
$ 12,362 |
$ 13,220 |
||
Unavailable |
5,845 |
5,777 |
||
Obligated Balance not yet Disbursed |
117,876 |
113,595 |
||
Non-Budgetary FBWT |
(36,445) |
(34,925) |
||
Total |
$ 99,638 |
$ 97,667 |
Other Funds include balances in deposit, suspense, clearing, and related non-spending accounts.
The Unobligated Balance includes $2.1 billion, which is restricted for future use and is not apportioned for current use. These funds are: Contingency Fund for State Welfare Programs of the Administration for Children and Families; the Program Management Funds of the Centers for Medicare & Medicaid Services; the Federal Interest Subsidies for Medical Facilities, Medical Facilities Guarantee and Loan Fund of the Health Resources and Services Administration; and the Service and Supply Funds of the Program Support Center.
The Non-Budgetary FBWT negative balance is due primarily to CMS Medicare trust funds temporarily precluded from obligation.
Note 4. Cash and Other Monetary Assets
Cash and Other Monetary Assets consist primarily of the time account balances at the Medicare contractors’ commercial banks. CMS uses the “Checks Paid Letter-of-Credit” method for reimbursing Medicare contractors for the payment of covered Medicare services. Medicare contractors issue checks against Medicare Benefits Accounts maintained at commercial banks. To compensate the commercial banks for handling the Medicare Benefits Accounts, Medicare funds are deposited into non-interest bearing time accounts. The interest foregone by the CMS on these time accounts is used to reimburse the commercial banks for the service. The account balances as of September 30, 2005 and 2004 were $204 million and $460 million, respectively.
Note 5. Investments, Net
HHS’ investments at September 30, 2005 and 2004 are summarized below.
2005 |
|||||
|---|---|---|---|---|---|
(Dollars in Millions) |
Cost |
Unamortized (Premium) Discount |
Investments, Net |
Other Adjustments |
Market Value Disclosure |
Intragovernmental Securities |
|||||
Marketable |
$18 |
$ - |
$ 18 |
$ - |
$ 18 |
Non-Marketable: Par Value |
294,471 |
- |
294,471 |
- |
294,471 |
Non-Marketable: Market-based |
2,169 |
21 |
2,190 |
- |
2,190 |
Subtotal |
$296,658 |
$21 |
$ 296,679 |
$- |
$296,679 |
Accrued Interest |
3,985 |
- |
3,985 |
- |
3,985 |
Total, Intragovernmental |
$300,643 |
$21 |
$ 300,664 |
$- |
$300,664 |
2004 |
|||||
|---|---|---|---|---|---|
(Dollars in Millions) |
Cost |
Unamortized (Premium) Discount |
Investments, Net |
Other Adjustments |
Market Value Disclosure |
Intragovernmental Securities |
|||||
Marketable |
$17 |
$ - |
$ 17 |
$ 1 |
$ 18 |
Non-Marketable: Par Value |
281,814 |
- |
281,814 |
- |
281,814 |
Non-Marketable: Market-based |
2,018 |
48 |
2,066 |
- |
2,066 |
Subtotal |
$283,849 |
$ 48 |
$ 283,897 |
1 |
$ 283,898 |
Accrued Interest |
3,988 |
- |
3,988 |
- |
3,988 |
Total, Intragovernmental |
$287,837 |
$48 |
$ 287,885 |
$ 1 |
$ 287,886 |
HHS invests entity trust fund balances in excess of current needs in U.S. Treasury securities. The majority of HHS investments in securities are redeemed at maturity and no provision is made for unrealized gains or losses. The Department of Treasury acts as the fiscal agent for the U.S. Government’s investments in securities. HHS securities purchased and redeemed include Marketable, Non-Marketable (Par Value), and Non-Marketable Market-based (MK) securities.
Par value securities purchased by the Centers for Medicare & Medicaid Services (CMS) are recorded at cost, interest is earned based on a statutory formula, and securities are redeemed at face value. CMS invests in U.S. Treasury Special Issue bonds (Par value securities) that are special public obligations for exclusive purchase by the Medicare trust funds. Section 1817 (for Hospital Insurance) and section 1841 (for Supplemental Medical Insurance) of the Social Security Act require that trust fund investments not necessary to meet current expenditures be invested in interest-bearing obligations of the United States or in obligations guaranteed as to both principal and interest by the United States. These investments are carried at face value as determined by Treasury. Interest income is compounded semiannually (June and December). The Medicare bonds paid from 3 � percent to 8 ? percent in FY 2005 and 3 � percent to 8 � in FY 2004. The One Day Certificates are short-term and paid 4 ? percent in FY 2005 and 4 � percent in FY 2004.
Health Resources and Services Administration (HRSA) invests in One Day Certificates, Market Based Notes and Market Based Bills. MK securities purchased by HRSA mirror marketable securities terms that are not traded on any securities exchange, and include Non-Marketable, MK, and One Day Certificates. MKs are purchased by HRSA’s Vaccine Injury Compensation Program (VICP) trust fund. Discounts and premiums are recorded and amortized on a straight-line basis. Currently, securities held by the VICP will mature in fiscal years 2005 through 2009. The Market Based Notes paid from 1.625 percent to 6.25 percent in FY 2005 and FY 2004. One Day Certificates paid from 1.71 percent to 3.17 percent in FY 2005 and from .91 percent to 1.77 percent in FY 2004.
Marketable securities purchased by the National Institutes of Health gift funds are recorded at cost based on market terms.
Note 6. Accounts Receivable, Net
HHS’ accounts receivable as of September 30, 2005 and 2004 are summarized below.
2005 |
|||||||||
|---|---|---|---|---|---|---|---|---|---|
(Dollars in Millions) |
Accounts Receivable Principal |
Interest Receivable |
Penalties, Fines, & Admin Fees Receivable |
Accounts Receivable, Gross |
Allowance |
Net OPDIV Receivables Combined |
Intra-OPDIV Eliminations |
Inter-OPDIV Eliminations |
Net HHS Receivables Consol. |
Intragovernmental |
|||||||||
Entity |
$42,854 |
$- |
$- |
$42,854 |
$- |
$ 42,854 |
$(41,884) |
$ (232) |
$ 738 |
Non-Entity |
- |
- |
- |
- |
- |
- |
- |
- |
- |
Total, Intragovernmental |
$42,854 |
$- |
$- |
$42,854 |
$- |
$ 42,854 |
$(41,884) |
$ (232) |
$ 738 |
With the Public |
|||||||||
Entity |
|||||||||
Medicare |
$3,322 |
$- |
$- |
$3,322 |
$(1,508) |
$ 1,814 |
$- |
$ - |
$ 1,814 |
Other |
465 |
- |
69 |
534 |
(259) |
275 |
- |
- |
275 |
Non-Entity |
12 |
44 |
- |
56 |
(42) |
14 |
- |
- |
14 |
Total, |
$3,799 |
$44 |
$69 |
$3,912 |
$(1,809) |
$ 2,103 |
$- |
$ - |
$ 2,103 |
Note 6. Accounts Receivable, Net (continued)
2004 |
|||||||||
|---|---|---|---|---|---|---|---|---|---|
(Dollars in Millions) |
Accounts Receivable Principal |
Interest Receivable |
Penalties, Fines, & Admin Fees Receivable |
Accounts Receivable, Gross |
Allowance |
Net OPDIV Receivables Combined |
Intra-OPDIV Eliminations |
Inter-OPDIV Eliminations |
Net HHS Receivables Consol. |
Intragovernmental |
|||||||||
Entity |
$41,518 |
$- |
$- |
$41,518 |
$- |
$41,518 |
$(40,708) |
$(237) |
$ 573 |
Non-Entity |
- |
- |
- |
- |
- |
- |
- |
- |
- |
Total, Intragovernmental |
$41,518 |
$- |
$- |
$41,518 |
$- |
$41,518 |
$(40,708) |
$(237) |
$ 573 |
With the Public |
|||||||||
Entity |
|||||||||
Medicare |
$2,908 |
$- |
$- |
$2,908 |
$(1,556) |
$1,352 |
$- |
$- |
$ 1,352 |
Other |
1,419 |
- |
- |
1,419 |
(743) |
676 |
- |
- |
676 |
Non-Entity |
15 |
83 |
- |
98 |
(74) |
24 |
- |
- |
24 |
Total, |
$4,342 |
$83 |
$- |
$4,425 |
$(2,373) |
$2,052 |
$- |
$- |
$ 2,052 |
The Federal Hospital Insurance (HI) Trust Fund accrues a receivable from the Railroad Retirement Board (RRB) for amounts transferred through a financial interchange between the HI and RRB. The financial interchange is intended to place the HI trust fund in the same position it would have been had railroad employment been covered by the Federal Insurance Contributions Act. Of the Intragovernmental Accounts Receivable, net as of September 30, 2005 and 2004, $454 million and $421 million were owed by the RRB, respectively.
The Department’s accounts receivable with the public is primarily composed of Medicare receivables resulting from overpayments to Medicare providers, beneficiaries, physicians and suppliers, as well as repayments owed on claims where Medicare should have been the secondary payer. The remainder represents receivables arising from Medicaid cost disallowances.
For Medicare receivables, the Centers for Medicare & Medicaid Services calculates the allowance for uncollectible accounts receivable based on the collection activity and the age of the debt for the most current fiscal year, while taking into consideration the average uncollectible percentage for the past five years. The Medicaid accounts receivable have been recorded at a net realizable amount based on historic analysis of actual recoveries and the rate of disallowances found in favor of the states.
Non-entity accounts receivable consists of receivables for interest and penalties that cannot be used by the Department once collected. Such collections are transferred to the General Fund of the Treasury.
Note 7. Anticipated Congressional Appropriation
The Centers for Medicare & Medicaid Services (CMS) has recorded $14,272 million in anticipated Congressional appropriations as of September 30, 2005 ($9,248 million for FY 2004) to cover liabilities incurred as of September 30 by the Medicaid program and the Payments to the Health Care Trust Funds appropriation, as discussed below:
Medicaid
Beginning in FY 1996, CMS has accrued an expense and liability for Medicaid claims “Incurred But Not Reported,” or Medicaid IBNR, as of September 30. In FY 2005, the IBNR expense exceeded the available unexpended Medicaid appropriations in the amount of $9,099 million ($3,603 million in FY 2004). A review of appropriation language by CMS’ Office of General Counsel has resulted in a determination that the Medicaid appropriation’s indefinite authority provision allows for the entire IBNR amount to be reported as a funded liability. Consequently, CMS has recorded a $9,099 million anticipated appropriation in FY 2005 ($3,603 million in FY 2004) for Medicaid IBNR claims that exceed the available appropriation.
Payments to the Health Care Trust Funds
The Supplemental Medical Insurance (SMI) program is financed primarily by the General Fund appropriation, Payments to the Health Care Trust Funds, and monthly premiums paid by beneficiaries. Section 1844 of the Social Security Act authorizes funds to be appropriated from the General Fund to match premiums payable and deposited in the trust fund. Section 1844 also outlines the ratio for the match as well as the method used to make the trust funds whole if insufficient funds are available in the appropriation to match all SMI premiums received in the fiscal year. The appropriated amount is an estimate calculated annually by CMS’ Office of the Actuary (OACT) and may be insufficient in any particular fiscal year.
In FY 2005, the estimate was insufficient and the matching ceased prior to the close of the fiscal year. At September 30, approximately $5,107.4 million should have been matched to premiums paid by beneficiaries. OACT calculated an additional $65.3 million in interest on unmatched amounts, leaving a cumulative liability of $5,173 million owed to SMI. When this occurs, Section 1844 allows for a reimbursement to be made to the SMI trust fund from the Payments to the Health
Care Trust Funds appropriation enacted for the following year. Consequently, CMS has recorded $5,173 million anticipated appropriation in FY 2005 ($5,645 million in FY 2004) for the amount of the unmatched SMI premiums. Although the actual transfer of funds will occur in FY 2006, CMS has reported the $5,173 million as revenues earned in FY 2005.
In addition, the $5,173 million in unmatched SMI premiums is reported as Other Liability “Requiring or Generating Resources in Future Periods” on the Consolidated Statement of Financing.
Note 8. Loan Guarantee Receivables and Liabilities
The Health Resources and Services Administration (HRSA) operates guaranteed loan programs for the Health Education Assistance Loans (HEAL) and the Health Center programs.
For HEAL loans, HRSA guarantees the payment of the principal and interest on the loans made by private lenders to medical students (who are enrolled in various approved fields of practice) in the event of:
In the event of default on a HEAL loan, the lender is responsible for 2 percent of the cost of each defaulted loan. In cases of death or permanent disability, the full amount of the principal and related interest are written off against the Allowance for Uncollectible Accounts since no further collection action is warranted.
Legislation that enabled the HEAL program to guarantee new loans to student borrowers expired September 30, 1998. Through September 30, 2004, HHS was authorized to allow existing HEAL recipients to refinance their loans into new guaranteed loans. The retirement of loans being refinanced was considered a receipt of principal and interest. This receipt was offset by the disbursement related to the newly-created loan. The underlying loan, in any given cohort, was paid off in its original cohort, and a new loan was opened in the cohort in which refinancing activity occurred.
For reporting purposes under the Credit Reform Act of 1990 (Public Law 101-508), loans are classified by date of obligation as either Pre-1992 or Post-1991 loans. The HEAL program has loans in both categories.
The Health Center Program guarantees loans (classified as Post-1991) to HRSA grantees, which are made by non-federal lenders to the health centers for the cost of developing and operating managed care networks or plans. HRSA guarantees the negotiated contract percentage of the outstanding balance at no greater than 80 percent. Loans guaranteed at greater than 80 percent must receive a waiver from the Office of Management and Budget (OMB) to do so.
On guaranteed loans obligated beginning in FY 1992 (Post-1991), subsidy cost is calculated using the net present value of projected lifetime costs and is revalued annually through the OMB Subsidy Credit Model re-estimate process. This subsidy cost may be positive or negative. A negative subsidy occurs when expected program inflows of cash exceed expected outflows.
HRSA uses a computerized cash flow projection model to calculate estimates of all future cash flows associated with Post-1991 HEAL or Health Center loans to develop subsidy estimates. Cash flows are projected for 30 years and aggregated by cohort year. A loan’s cohort year represents the year a loan was guaranteed, regardless of the timing of the disbursement.
Total loans guaranteed under these programs, as of September 30, 2005 and 2004 are summarized as follows.
(Dollars in Millions) |
2005 |
2004 |
|||
|---|---|---|---|---|---|
HEAL Loan Guarantees: |
No. of Loans |
Amount |
No. of Loans |
Amount |
|
Pre-1992 loans |
35,050 |
$272 |
41,734 |
$331 |
|
Post-1991 loans |
55,313 |
1,465 |
66,815 |
1,697 |
|
Health Centers Loan Guarantees |
10 |
32 |
12 |
39 |
|
Total |
90,373 |
$ 1,769 |
108,561 |
$2,067 |
|
Loan guarantee receivables:
The receivable amount reported in the Balance Sheet represents both the defaulted loans and the related interest, which have been paid to lenders under the guarantee. The lenders are required to perform certain debt collection procedures in an effort to collect amounts due prior to submitting the guaranteed loan for payment. An allowance for loss has been established for estimated uncollectible amounts on the loans. The allowance is based on management’s assessment of the future collectibility of these aged loans based on the last date of collection.
Interest receivable and interest revenue are recognized on all loans at the stated rate or, in cases of judgment, court-mandated rate. Interest is accrued monthly and compounded semiannually for non-judgment cases, and accrued quarterly and compounded annually for judgment cases. Nevertheless, interest is accrued on both performing and non-performing loans.
The defaulted loans receivable for guaranteed loans at September 30, 2005 and 2004 are summarized below.
2005 |
|||||
|---|---|---|---|---|---|
(Dollars in Millions) |
Loans, Receivable, Principal |
Interest Receivable |
Loans Receivable, Gross |
Allowance |
Loans, Receivable, Net |
Defaulted Guaranteed Loans |
|||||
HEAL Loans (HRSA) |
|||||
Pre-1992 Loans |
$ 461 |
$15 |
$ 476 |
$ (199) |
$ 277 |
Post-1991 Loans |
140 |
7 |
147 |
(45) |
102 |
Subtotal |
$ 601 |
$ 22 |
$ 623 |
$(244) |
$ 379 |
Health Centers |
|||||
Pre-1992 Loans |
- |
- |
- |
- |
- |
Post-1991 Loans |
4 |
- |
4 |
(4) |
- |
Total |
$ 605 |
$ 22 |
$ 627 |
$ (248) |
$ 379 |
Note 8. Loan Guarantee Receivables and Liabilities (continued)
2004 |
|||||
|---|---|---|---|---|---|
(Dollars in Millions) |
Loans, Receivable, Principal |
Interest Receivable |
Loans Receivable, Gross |
Allowance |
Loans, Receivable, Net |
Defaulted Guaranteed Loans |
|||||
HEAL Loans (HRSA) |
|||||
Pre-1992 Loans |
$ 472 |
$ 12 |
$ 484 |
$ (198) |
$ 286 |
Post-1991 Loans |
133 |
5 |
138 |
(34) |
104 |
Subtotal |
$ 605 |
$ 17 |
$ 622 |
$ (232) |
$ 390 |
Health Centers |
|||||
Post-1991 Loans |
4 |
- |
4 |
(4) |
- |
Total |
$609 |
$ 17 |
$ 626 |
$ (236) |
$ 390 |
Loan guarantee liabilities:
In accordance with the Credit Reform Act of 1990, the loan guarantee liability for the Post-1991 loans is established based on the present value of cash flows, associated with the estimated amount to be paid out under loan guarantees for each fiscal (cohort) year as determined by original date of the loan guarantee or refinancing. The calculation is performed using a computer model established by OMB. The model utilizes assumptions made by the HEAL program based on historical data, such as default rates and interest rates. The liability is adjusted and accounted for independently each year based on loans issued annually under the guarantee.
The pre-1992 loan guarantee liability for loans is established based upon an average default rate of approximately 3.58 percent in fiscal year 2005 and 3.65 percent in fiscal year 2004. This liability is adjusted each year for the change in default rates.
The loans guarantee liabilities at September 30, 2005 and 2004 are summarized below.
(Dollars in Millions) |
2005 |
2004 |
|---|---|---|
Loan Guarantee Liabilities: |
||
HEAL Loans |
||
Pre-1992 Loans |
$ 10 |
$ 13 |
Post-1991 Loans |
144 |
172 |
Subtotal |
$ 154 |
$ 185 |
Health Center |
||
Post-1991 Loans |
4 |
6 |
Total Loan Guarantee Liabilities |
$ 158 |
$ 191 |
Note 8. Loan Guarantee Receivables and Liabilities (continued)
The reconciliation of loan guarantee liability for the Post-1991 loans is as follows:
(Dollars in Millions) |
2005 |
2004 |
|---|---|---|
Beginning Balance, Liability for Loan Guarantees |
$178 |
$347 |
Add: Subsidy Expense |
||
Default Costs (net of recoveries) |
$12 |
$ (3) |
Fees and Other Collections |
(12) |
(15) |
Other Subsidy Cost (death and disability) |
(15) |
(38) |
Total Subsidy Expense |
$(15) |
$(56) |
Adjustments: |
||
Interest Supplements |
0 |
0 |
Other |
40 |
(64) |
Total Adjustments |
$ 40 |
$(64) |
Subsidy Re-estimates |
||
Technical Re-estimates |
$(40) |
$(38) |
Interest Re-estimates |
(15) |
(11) |
Total Subsidy Re-estimates |
$(55) |
$(49) |
Ending Balance, Liability for Loan Guarantees |
$148 |
$178 |
Administrative expenses for the fiscal years reported are immaterial.
Loan guarantee subsidy expense:
The subsidy costs for the year ended September 30, 2005 is summarized as follows:
(Dollars in Millions) |
2005 |
2004 |
|---|---|---|
Subsidy Expense |
||
Default Costs (net of recoveries) |
$ 12 |
$(3) |
Fees and Other Collections |
(12) |
(15) |
Subsidy Re-Estimates (death and disability) |
(15) |
(38) |
Total Subsidy Expense |
$(15) |
$(56) |
Note 8. Loan Guarantee Receivables and Liabilities (continued)
The subsidy rates for Post-1991 loan guarantees programs are as follows for the current cohort year:
Loan Guarantee Programs: |
Subsidy |
Fees & Other Collections |
Other |
Total |
|---|---|---|---|---|
2005 |
||||
a. Health Education Assistance Loan Program (HEAL) |
N/A* |
N/A* |
N/A* |
|
b. Health Center Guarantee Loan Program (HCGLP) |
5.64% |
1% |
6.64% |
|
2004 |
||||
a. Health Education Assistance Loan Program (HEAL) |
16.48% |
16.48% |
||
b. Health Center Guarantee Loan Program (HCGLP) |
4.68% |
1% |
5.68% |
* Note that the subsidy rates are not applicable for there were no new loans for FY 2005.
Note 9. Inventory and Related Property, Net
HHS’ inventory and related property, net at September 30, 2005 and 2004 are summarized below.
(Dollars in Millions) |
2005 |
2004 |
|---|---|---|
Inventory Held for Sale: |
||
Inventory Held for Current Sale |
$19 |
$ 34 |
Inventory Held for Repair |
- |
- |
Total Inventory Held for Sale |
$19 |
$34 |
Operating Materials and Supplies: |
||
Operating Materials and Supplies Held for Use |
$5 |
$7 |
Operating Materials and Supplies Reserved for Future Use |
- |
- |
Total Operating Materials and Supplies |
$5 |
$7 |
Stockpile Materials: |
||
Stockpile Materials Held for Emergency or Contingency |
$1,590 |
$986 |
Total Stockpile Materials |
$1,590 |
$986 |
Inventory and Related Property, Gross |
$1,614 |
$1,027 |
Less: Allowance for Loss/Obsolescence/Spoilage |
- |
- |
Inventory and Related Property, Net |
$1,614 |
$1,027 |
On August 13, 2004, pursuant to the Project BioShield Act of 2004, the stockpile of vaccines and other medical supplies held in the Strategic National Stockpile (SNS) were transferred from the Department of Homeland Security to HHS in the amount of $868 million, with a corresponding budget authority of $626 million. SNS materials are not for sale and are maintained for use during local and national emergencies. The total SNS balance at the end of FY2005 amounts to $1,415 million and the SNS is valued at historical cost using the First-In/First-Out (FIFO) cost flow assumption method.
Note 10. General Property, Plant and Equipment, Net
Major categories of HHS General Property, Plant and Equipment (PP&E) at September 30, 2005 and 2004 are listed below.
2005 |
2004 |
|||||
|---|---|---|---|---|---|---|
(Dollars in Millions) |
Depreciation |
Estimated Useful Lives |
Acquisition Cost |
Accumulated Depreciation |
Net Book Value |
Net Book Value |
Land & Land Rights |
$48 |
$ - |
$48 |
$48 |
||
Construction in Progress |
723 |
- |
723 |
1,389 |
||
Buildings, Facilities & Other Structures |
Straight Line |
5-50 Yrs |
3,827 |
(1,355) |
2,472 |
1,583 |
Equipment |
Straight Line |
3-20 Yrs |
1,209 |
(530) |
679 |
571 |
Internal Use Software |
Straight Line |
7-10 Years |
606 |
(119) |
487 |
133 |
Assets Under Capital Lease |
Straight Line |
1-20 Years |
142 |
(32) |
110 |
115 |
Leasehold Improvements |
Straight Line |
*Life of Lease |
43 |
(5) |
38 |
38 |
Totals |
$6,598 |
$ (2,041) |
$4,557 |
$3,877 |
||
*7 to 15 years or the life of the lease.
Included in the FY 2005 and FY 2004 Net Book Value for Internal Use Software are UFMS capitalized costs totaling approximately $13 million for FY 2005 and $12 million for FY 2004. The $25 million represents capitalized cost incurred by the Program Management Office.
Note 11. Other Assets
Other Assets at September 30, 2005 and 2004 are comprised of the following, all of which are considered entity assets.
(Dollars in Millions) |
2005 |
2004 |
|---|---|---|
Intragovernmental |
||
Advances to Other Federal Entities |
$538 |
$745 |
Prepayments & Deferred Charges |
- |
- |
Other |
1 |
1 |
OPDIV Combined, Intragovernmental |
539 |
746 |
Less: Intra-OPDIV Eliminations |
(366) |
(338) |
OPDIV Consolidated, Intragovernmental |
173 |
408 |
Less: Inter-OPDIV Eliminations |
(4) |
(22) |
HHS Consolidated, Intragovernmental |
$169 |
$386 |
With the Public |
||
Prepayments and Deferred Charges |
$4,044 |
$80 |
Travel Advances & Emergency Employee Salary Advances |
5 |
4 |
Other |
100 |
101 |
HHS Consolidated, With the Public |
$4,149 |
$185 |
Note 11. Other Assets (continued)
Advances to Other Federal Entities is largely comprised of advances from the National Institutes of Health (NIH) to the NIH Service and Supply Fund and the Management Fund to finance the NIH Business System (NBS) and the NIH Clinical Center, as well as advances from the Centers for Disease Control and Prevention and the Office of Secretary to the Department of Veterans Affairs for Strategic National Stockpile items.
The Prepayments and Deferred Charges with the Public primarily represent Managed Care advance payments made by the Center for Medicare & Medicaid Services under the Medicare Advantage plans for services that will be provided in October 2005.
Note 12. Liabilities Not Covered by Budgetary Resources
HHS’ liabilities not covered by budgetary resources at September 30, 2005 and 2004 are summarized below.
(Dollars in Millions) |
2005 |
2004 |
Intragovernmental |
||
Accounts Payable |
$- |
$ - |
Accrued Payroll and Benefits |
21 |
19 |
Other |
169 |
98 |
Total Intragovernmental |
$ 190 |
$ 117 |
Entitlement Benefits Due and Payable |
$ 9,470 |
$ 10,039 |
Federal Employees and Veterans’ Benefits |
7,183 |
7,178 |
Accrued Payroll and Benefits |
453 |
431 |
Other |
2,581 |
2,822 |
Total Liabilities Not Covered by Budgetary Resources |
$ 19,877 |
$ 20,587 |
Total Liabilities Covered by Budgetary Resources |
51,082 |
46,231 |
Total Liabilities |
$ 70,959 |
$ 66,818 |
|---|
Note 13. Entitlement Benefits Due and Payable
Entitlement Benefits Due and Payable represent benefits due and payable to the Public at year-end from entitlement programs enacted by law. The Medicare and Medicaid programs are the largest entitlement programs in HHS and comprise all of the HHS Entitlement Benefits Due and Payable.
Entitlement Benefits Due and Payable at September 30, 2005 and 2004 are summarized below.
2005 |
2004 |
|||||
|---|---|---|---|---|---|---|
(Dollars in Millions) |
Liabilities Covered by Budgetary Resources |
Liabilities Not Covered by Budgetary Resources |
Total |
Liabilities Covered by Budgetary Resources |
Liabilities Not Covered by Budgetary Resources |
Total |
Medicare |
$ 33,399 |
$ - |
$ 33,399 |
$ 29,875 |
$ - |
$29,875 |
Medicaid |
10,635 |
9,470 |
20,105 |
9,315 |
10,039 |
19,354 |
Other |
250 |
- |
250 |
- |
- |
- |
Totals |
$ 44,284 |
$9,470 |
$ 53,754 |
$ 39,190 |
$ 10,039 |
$49,229 |
As of September 30, 2005, Medicare benefits payable consisted of $33.4 billion of Medicare services incurred but not paid, as calculated by the CMS’ Office of the Acturary. The majority of the Medicaid benefits payable of $20 billion is for the estimated Federal share of expenses incurred by the states but not yet reported to CMS, based on historical relationships between Medicaid payables and current Medicaid activity. The estimate is reduced by amounts owed by the states for overpayment of Medicaid funds to providers, anticipated rebates from drug manufacturers, and settlements of probate and fraud and abuse cases.
Note 14. Federal Employee and Veterans’ Benefits
HHS’ Federal Employee and Veterans’ Benefits at September 30, 2005 and 2004 are summarized below. These liabilities are not covered by budgetary resources.
(Dollars in Millions) |
2005 |
2004 |
With the Public |
||
Liabilities Not Covered by Budgetary Resources |
||
PHS Commissioned Corp Pension Liability |
$ 6,287 |
$ 6,327 |
PHS Commissioned Corp Post-retirement Health Benefits |
627 |
582 |
Workers’ Compensation Benefits (Actuarial FECA Liability) |
269 |
269 |
Total, Federal Employee and Veterans’ Benefits |
$ 7,183 |
$ 7,178 |
|---|
Public Health Service Commissioned Corps: HHS administers the Public Health Service (PHS) Commissioned Corps Retirement System for approximately 5,880 active duty officers and 5,108 retiree annuitants or survivors. Authorized by Public Law 78-410, it is a defined noncontributory
Note 14. Federal Employee and Veterans’ Benefits (continued) benefit plan. The plan does not have accumulated assets; funding is provided entirely on a pay as you go basis by Congressional appropriations. Administrative costs are borne by the plan. The plan provides pension payments and medical benefits to eligible retirees. At September 30, 2005, the actuarial present value of accumulated plan pension benefits was $6,287 million of which $596 million was not vested, and the liability for medical benefits was actuarially determined to be $627 million.
Significant assumptions used by the actuary in its reports on the pension and medical programs as of September 30, 2005, were as follows:
Interest on Federal securities 6.25 percent
Annual basic pay scale increase 3.75 percent
Annual inflation 3.00 percent
Withdrawal and retirement rates are based on the historical trends of officers in the PHS retirement system. HHS applies aggregate entry age normal actuarial cost method to both programs to determine their liabilities.
The following shows key valuation results as of September 30, 2005 and 2004, in conformance with the actuarial reporting standards set forth in the Statement of Federal Financial Accounting Standards (SFFAS) No. 5, Accounting for Liabilities of the Federal Government.
(Dollars in Millions) |
2005 |
Restated 2004 |
|---|---|---|
SFFAS 5 Expense |
||
(a) Normal Cost |
$ 154 |
$ 150 |
(b) Interest Cost |
423 |
404 |
(c) Ongoing Cost (a & b) |
577 |
554 |
(d) Prior Service Cost & (Gains)/Losses |
(294) |
73 |
(e) Total Expense |
$ 283 |
$ 627 |
Workers’ Compensation Benefits: The actuarial liability for future workers’ compensation benefits includes the expected liability for death, disability, medical, and miscellaneous costs for approved compensation cases, plus a component for incurred but not reported claims.
The liability utilizes historical benefit payment patterns related to a specific incurred period to predict the ultimate payment related to that period. Consistent with past practice, these projected annual benefit payments have been discounted to present value using the OMB’s economic assumptions for 10-year Treasury notes and bonds. Interest rate assumptions utilized for discounting in FY 2005 and 2004 appear below.
Note 14. Federal Employee and Veterans’ Benefits (continued)
FY 2005 |
FY 2004 |
|---|---|
4.528% in Year 1 |
4.883% in Year 1 |
5.020% in Year 2 and thereafter |
5.235% in Year 2 and thereafter |
To provide more specifically for the effects of inflation on the liability for future workers’ compensation benefits, wage inflation factors (cost of living adjustments (COLAs)) and medical inflation factors (consumer price index medical (CPIMs)) are applied to the calculations for projected future benefits. These factors are also used to adjust historical payments to current year dollars. The anticipated percentages for COLAs and CPIMs used in projections are:
FY |
COLA |
CPIM |
2005 |
2.20% |
4.33% |
2006 |
3.33% |
4.09% |
2007 |
2.93% |
4.01% |
2008 |
2.40% |
4.01% |
2009+ |
2.40% |
4.01% |
Note 15. Accrued Grant Liability
Grant advances are liquidated upon the grantees’ reporting of expenditures on the quarterly Federal Cash Transaction Report (SF-272). In many cases, HHS receives these reports several months after the grantee incurs the expense, resulting in an understated grant expense in the financial statements. To mitigate this, HHS developed departmental procedures to estimate and accrue amounts due grantees for their unreported expenses through September 30.
At fiscal year-end, the OPDIVs record the liability based on the estimated accrual for unreported grantees’ expenses. If the amount of the collective OPDIV advances outstanding exceeds the amount of the collective estimated expenses, HHS reports the difference as "Advances to Grantees". On the other hand, if the amount of the estimated expenses exceeds the amount of the collective advances outstanding, HHS reports the difference as “Accrued Grant Liability”. For additional information on this subject, see Note 1 under subtitle “Advances to Grantees/Accrued Grant Liability”.
HHS’ net grant advances (liability) at September 30, 2005 and 2004 are summarized below.
2005 |
2004 |
|
|---|---|---|
Grant Advances Outstanding (before year-end grant accrual) |
$ 15,491 |
$ 15,087 |
Less: Estimated Accrual for Amounts Due to Grantees |
(19,274) |
(18,842) |
Net Grant Advances (Liability) |
$ (3,783) |
$ (3,755) |
Note 16. Other Liabilities
HHS’ other liabilities at September 30, 2005 and 2004 are summarized below.
Intragovernmental |
With the Public |
|||||
|---|---|---|---|---|---|---|
(Dollars in Millions) 2005 |
Liabilities Covered by Budgetary Resources |
Liabilities Not Covered by Budgetary Resources |
Total |
Liabilities Covered by Budgetary Resources |
Liabilities Not Covered by Budgetary Resources |
Total |
Advances from Others |
$ - |
$ - |
$ - |
$ 15 |
$ - |
$ 15 |
Deferred Revenue |
475 |
- |
475 |
552 |
- |
552 |
Liabilities for Deposit Funds, Clearing Accounts and Undeposited Collections |
1 |
- |
1 |
(177) |
- |
(177) |
Contingent Liabilities |
- |
- |
- |
- |
2,266 |
2,266 |
Capital Lease Liability |
- |
86 |
86 |
31 |
5 |
36 |
Custodial Liabilities |
- |
84 |
84 |
- |
5 |
5 |
Vaccine Injury Compensation Program |
- |
- |
- |
- |
265 |
265 |
Environmental and Disposal Costs |
- |
- |
- |
2 |
31 |
33 |
Other |
805 |
(1) |
804 |
134 |
9 |
143 |
Combined OPDIV Totals |
$ 1,281 |
$ 169 |
$ 1,450 |
$ 557 |
$ 2,581 |
$ 3,138 |
Less: Intra-OPDIV Eliminations |
(366) |
- |
(366) |
- |
- |
- |
Consolidated OPDIV Totals |
$ 915 |
$ 169 |
$ 1,084 |
$ 557 |
$ 2,581 |
$ 3,138 |
Less: Inter-OPDIV Eliminations |
(92) |
- |
(92) |
- |
- |
- |
Consolidated HHS Totals |
$ 823 |
$ 169 |
$ 992 |
$ 557 |
$ 2,581 |
$ 3,138 |
Intragovernmental |
With the Public |
|||||
|---|---|---|---|---|---|---|
(Dollars in Millions) 2004 |
Liabilities Covered by Budgetary Resources |
Liabilities Not Covered by Budgetary Resources |
Total |
Liabilities Covered by Budgetary Resources |
Liabilities Not Covered by Budgetary Resources |
Total |
Advances from Others |
$ 115 |
$ - |
$ 115 |
$ - |
$ - |
$ - |
Deferred Revenue |
351 |
- |
351 |
262 |
- |
262 |
Liabilities for Deposit Funds, Clearing Accounts and Undeposited Collections |
- |
- |
- |
19 |
- |
19 |
Contingent Liabilities |
- |
- |
- |
- |
2,455 |
2,455 |
Capital Lease Liability |
- |
88 |
88 |
30 |
5 |
35 |
Custodial Liabilities |
- |
10 |
10 |
- |
- |
- |
Vaccine Injury Compensation Program |
- |
- |
- |
- |
313 |
313 |
Environmental and Disposal Costs |
- |
- |
- |
3 |
33 |
36 |
Other |
691 |
- |
691 |
280 |
16 |
296 |
Combined OPDIV Totals |
$ 1,157 |
$ 98 |
$ 1,255 |
$ 594 |
$ 2,822 |
$ 3,416 |
Less: Intra-OPDIV Eliminations |
(338) |
- |
(338) |
- |
- |
- |
Consolidated OPDIV Totals |
$ 819 |
$ 98 |
$ 917 |
$ 594 |
$ 2,822 |
$ 3,416 |
Less: Inter-OPDIV Eliminations |
(132) |
- |
(132) |
- |
- |
- |
Consolidated HHS Totals |
$ 687 |
$ 98 |
$ 785 |
$ 594 |
$ 2,822 |
$ 3,416 |
Note 16. Other Liabilities (continued)
The majority of the other liabilities include Deferred Revenue, Contingent Liabilities, and the Vaccine Injury Compensation Program, and Other Intragovernmental Liabilities.
Deferred Revenue:
The Centers for Medicare & Medicaid Services routinely receive premium payments on behalf of select categories of beneficiaries from third parties. In some instances, the payments received exceed the amount billed. As of the end of the accounting period, the excess collections are reported as deferred revenue received that will be applied against the next month’s premium bill.
CMS accounts for $267 million of the Deferred Revenue with the Public.
In addition, Food and Drug Administration (FDA) collects fees in relation to its various user fee appropriations. FDA accounts for $186 million of the Deferred Revenue with the Public for the portion of the fees collected during current fiscal year that should be applied to the next fiscal year. Indian Health Service accounts for $148 million of the Intragovernmental Deferred Revenue for construction-in-process projects primarily under the Contribution, Indian Health Facilities fund, and $52 million of the Deferred Revenue with the Public for the Tribal Buybacks. Substance Abuse and Mental Health Services Administration accounts for $122 million Intragovernmental Deferred Revenue for interagency agreement with another federal agency to award and administer the Drug Free Communities program grants. The Vaccine Injury Compensation Program administered by the Health Resources and Services Administration accounts for $79 million in Intragovernmental Deferred Revenue arising from the provision of goods and services by the program.
Contingent Liabilities:
Through the issuance of grants, HRSA supports the operation of certain health centers under the Health Centers Consolidation Act of 1996. These grantees, and many of their health professionals, are provided malpractice insurance under the Federally Supported Health Centers Assistance Act. Settlements and awards are paid from a separate Fund in the Treasury (Appropriation 75x0365). Accordingly, there are numerous malpractice legal actions pending against these grantees, which if settled, will be paid by HRSA. HRSA’s legal actions make up the majority of the Contingent Liabilities. For FY 2005 and FY 2004, HRSA’s actuarial contractor estimated the preliminary Contingent Liability to be $586 million. These liabilities include the incurred but not reported (IBNR) amount of $194 million and the expected payouts for fiscal years 2005 to 2007 of $203 million for the Community Health Center program.
CMS routinely process and settle cost reports and payment issues for institutional providers and healthcare insurers. As part of this process, some providers/insurers have filed suits challenging the amount of reimbursement to which they claim entitlement. CMS cannot reasonably estimate the probability of the providers successfully winning their suits or the exact amount of the potential loss to the Medicare trust funds.
Note 16. Other Liabilities (continued)
Included in other liabilities at September 30, 2005 is an estimated amount for a contingent liability payable to States (to reimburse them for payments they have paid on behalf of beneficiaries) at an amount of approximately $1,648 million ($1,867 million in FY 2004), for probable unasserted claims that resulted from processing errors where incorrect Medicare eligibility determinations were made. No claims have been filed. Because appropriation law requires Congress to authorize the transfer of funds out of the Medicare Trust Funds into an appropriation account, the Medicare Trust Funds cannot reimburse the Health Program accounts in the General Fund of the Treasury absent Congressional authorization. The CMS does not intend to seek such Congressional authorization and there will be no transactions recorded between the Trust Funds and the Health Programs’ accounts in the general fund.
Other liabilities do not include all provider cost reports under appeal at the Provider Reimbursement Review Board (PRRB) since monetary effect of those appears is generally not known until a decision is rendered. The PRRB gets no information on the value of the cases that are settled prior to a hearing. Data is available for only the 72 cases that were decided in FY 2005. As cases are decided, the settlement value paid is considered in the development of the actuarial liability estimate.
The following contingent liabilities for which a loss has been determined to be reasonably possible have not been accrued in the Department’s financial statements:
The CMS expects that as of September 30, 2005, it is reasonably possible that as much as $2.8 billion could be owed to providers for previous years' disputed cost report adjustments for disproportionate share hospitals. Two United States Circuit Courts of Appeals have decided cases in which CMS has litigated these issues. One court has ruled in favor of CMS, reaffirming CMS' decision to deny cost report reopenings. The other court has ruled against CMS and instructed CMS to reopen certain providers' cost reports. CMS intends to vigorously contest this latter decision. Any potential payment of any funds related to these claims would be based on the providers’ ability to comply with the legal requirement that they provide adequate documentation to support their claims and overcome any other legal defenses.
Under earlier applicable law, Medicare, in certain circumstances, reimbursed hospitals for losses incurred on the disposal of assets. The CMS is currently defending claims relating to a number of mergers and consolidations that occurred between non-profit hospitals prior to the 1997 change in the law. The CMS expects that as of September 30, 2005, it is reasonably possible that from $119 million to $259 million may be owed to providers for unreimbursed costs reported on their Medicare cost reports. CMS intends to vigorously defend this case.
As of September 30, 2005, management expects that it is reasonably possible that up to $106 million may be owed for asserted claims associated with Medicaid cost disallowance cases.
Note 16. Other Liabilities (continued)
In addition, SAMHSA expects that it is reasonably possible that the agency may owe as much as $12 million as a result of federal claims court case. At this time, the parties are considering options including appeal and settlement, and pending legislation may affect whether any funds will be owed to the litigant.
In the opinion of management, the resolution of these matters will not have a material impact on the results of operations and financial condition of HHS.
Vaccine Injury Compensation Program (VICP):
The VICP is administered by HRSA and provides compensation for vaccine-related injury or death. The $265.4 million VICP liability represents the estimated future payment value of injury claims outstanding for VICP as of September 30, 2005.
Other Intragovernmental Liabilities:
Other Intragovernmental Liabilities of $992 million are comprised of $433 million, of which CMS owe to other Federal entities, primarily to the Department of Treasury ($401 million at September 30, 2005). CMS’ payable to Treasury is a result of the receivables from the beneficiaries and Medicare contractors. As of September 30, 2005 beneficiaries owe $388 million to CMS for Medicare Hospital Insurance and Supplemental Medical Insurance premiums. Medicare contractors have also reported $13 million in interest owed on Medicare overpayments. CMS owes other Federal entities $32 million for services performed through interagency agreements.
Environmental and Disposal Costs:
The Comprehensive Environmental Response Compensation and Liability Act, the Comprehensive Environmental Cleanup and Responsibility Act, the Superfund Amendments and Reauthorization Act of 1986, and the Conservation Recovery Act of 1976, are several laws and regulations, which require HHS to remove, contain, and/or dispose of hazardous waste. Environmental and disposal costs are the costs of removing, containing, and/or disposing of (1) hazardous waste from property, or (2) material and or property that consists of hazardous waste at a permanent or temporary closure or shutdown of associated property, plant or equipment. The majority of the environmental and disposal costs consist of Indian Health Service’s liabilities associated with surveying, testing, and remediating contaminated sites and National Institutes of Health ground water remediation project in accordance with applicable laws and regulations.
Note 17. Leases
Capital Leases:
HHS has entered into various capital leases with Native American and Alaskan Native tribes and with the General Services Administrations (GSA) for office and warehouse space. Lease terms vary from 1 to 20 years. Capitalized assets acquired under capital lease agreements and the related liabilities are reported at the present value of the minimum lease payments.
Operating Leases:
HHS has commitments under various operating leases with private entities and GSA for office, laboratory spaces, and land. Leases with private entities have initial or remaining noncancelable lease terms from 1 to 20 years. GSA leases in general are cancelable with 120 days notice. Under an operating lease, the cost of the lease is expensed as incurred.
During FY 2003, based on the criteria set forth by the OMB Circular No. A-11, Preparation, Submission, and Execution of the Budget, NIH identified eight capital leases that were previously recorded as operating leases; however, the analysis of the terms of the leases and the final determination was not completed until FY 2004. The FY 2003 operating and capital leases were restated to record the eight capital leases. Subsequently, the lease agreements were modified and, in the final quarter of FY 2004, options were dropped on six of the eight capital leases, leaving only two capital leases reclassified under the OMB criteria. FY 2004 does not include the six leases reclassified as operating leases after options were dropped. After reclassifying, only two leases are capital leases under the OMB criteria. In FY 2005, the remaining two leases are properly reported as capital leases, and the issue has been closed with OMB. In addition to the capital lease issue, NIH has operating leases that do not have cancellation clauses and the obligation for the full term of the lease is not recorded. The issue is currently under review and resolution will not occur for the FY 2005 reporting period. The total liability for these leases over the life of the lease term is $553.8 million in FY 2005 and $578.6 million in FY 2004.
A Summary of Net Assets under Capital Lease and Future Minimum Lease Payments at September 30, 2005 and 2004 follows.
(Dollars in Millions) |
2005 |
2004 |
|---|---|---|
Summary of Net Assets Under Capital Lease |
||
Land and Building |
$ 140 |
$ 140 |
Machinery and Equipment |
2 |
1 |
Other |
- |
- |
Subtotal |
$ 142 |
$ 141 |
Less: Accumulated Amortization |
(32) |
(26) |
Assets Under Capital Lease |
$ 110 |
$ 115 |
(Dollars in Millions) |
2005 |
2004 |
||||
|---|---|---|---|---|---|---|
Capital Leases |
Operating Lease |
Capital Leases |
Operating Lease |
|||
Future Minimum Lease Payments |
||||||
Year 1 |
$ 12 |
$ 322 |
$ 12 |
$ 263 |
||
Year 2 |
12 |
342 |
12 |
260 |
||
Year 3 |
12 |
348 |
12 |
266 |
||
Year 4 |
13 |
355 |
12 |
271 |
||
Year 5 |
13 |
340 |
12 |
276 |
||
Later Years |
149 |
1,064 |
152 |
463 |
||
Total Minimum Lease Payments |
$ 211 |
$ 2,771 |
$ 212 |
$ 1,799 |
||
Less: Imputed Interest |
(89) |
(89) |
||||
Total Capital Lease Liability |
$ 122 |
$ 123 |
||||
Note 18. Consolidated Gross Cost and Earned Revenue by Budget Functional Classification
HHS’ consolidated gross cost and exchange revenue by budget functional classification for the fiscal years ended September 30, 2005 and 2004 are summarized below.
2005 |
2004 |
|||||||||
|---|---|---|---|---|---|---|---|---|---|---|
(Dollars in Millions) |
Education Training and Social Services |
Health |
Medicare |
Income Security |
Admin. of Justice |
Natural Resources/ Environment |
OPDIV Combined Totals |
Intra-HHS Eliminations |
HHS Consolidated Totals |
HHS Consolidated Totals |
Intragovernmental |
||||||||||
Gross Cost |
$ 171 |
$ 4,667 |
$ 547 |
$ 25 |
$ - |
$ - |
$ 5,410 |
$ (1,875) |
$ 3,535 |
$ 3,412 |
Less: Earned Revenue |
(25) |
(2,736) |
(10) |
(6) |
- |
- |
(2,777) |
1,692 |
(1,085) |
(839) |
Net Cost, Intragovernmental |
$ 146 |
$ 1,931 |
$537 |
$19 |
$ - |
$ - |
$ 2,633 |
$ (183) |
$ 2,450 |
$ 2,573 |
With the Public |
||||||||||
Gross Cost |
$ 12,469 |
$237,123 |
$333,425 |
$35,446 |
$ - |
$ - |
$ 618,463 |
$ - |
$ 618,463 |
$ 578,056 |
Less: Earned Revenue |
- |
(1,344) |
(38,249) |
- |
- |
- |
(39,593) |
- |
(39,593) |
(33,409) |
Net Cost, |
$ 12,469 |
$235,779 |
$295,176 |
$35,446 |
$ - |
$ - |
$ 578,870 |
$ - |
$ 578,870 |
$ 544,647 |
Totals |
||||||||||
Gross Cost |
$ 12,640 |
$241,790 |
$333,972 |
$35,471 |
$ - |
$ - |
$ 623,873 |
$ (1,875) |
$ 621,998 |
$ 581,468 |
Less: Earned Revenue |
(25) |
(4,080) |
(38,259) |
(6) |
- |
- |
(42,370) |
1,692 |
(40,678) |
(34,248) |
Net Cost of Operations |
$ 12,615 |
$237,710 |
$295,713 |
$35,465 |
$ - |
$ - |
$ 581,503 |
$ (183) |
$ 581,320 |
$ 547,220 |
Note 19. Exchange Revenue
HHS recognizes its revenue from exchange transactions when goods and services are provided. Total exchange revenue was $40.7 billion and $34.2 billion for the years ended September 30, 2005 and 2004, respectively. HHS’ exchange revenue primarily consists of Medicare premiums collected from beneficiaries.
Premiums Collected are used to finance Supplemental Medical Insurance (SMI) benefits and administrative expenses. Monthly premiums paid by Medicare beneficiaries are matched by the Federal government through the General Fund appropriation, Payments to the Health Care Trust Funds. Section 1844 of the Social Security Act authorizes appropriated funds to match SMI premiums collected, and outlines the ratio for the match as well as the method to make the trust funds whole if insufficient funds are available in the appropriation to match all premiums received in the fiscal year.
HHS’ pricing policy under the reimbursable agreements is to recover full cost and to incur no profit or loss. Most OPDIVs either charge full cost or are implementing procedures to do so.
In addition to revenues related to reimbursable agreements, HHS collects various user fees to finance its programs. Certain fees charged by HHS are based on an amount set by law or regulations and may not represent full cost.
Note 20. Prior Period Adjustments
To correct errors and accounting changes with retroactive effect, HHS included prior period adjustments in the calculation of the net change in cumulative results of operations and unexpended appropriations. The following is a summary of the prior period adjustments comprised mainly of the IHS’ adjustments to accrued unfunded payroll, the NIH’s adjustments to royalty activity, and the OS’ adjustments to the stockpile transfer as of September 30, 2005 and 2004, respectively.
(Dollars in Millions) |
2005 |
2004 |
|---|---|---|
Increases (Decreases) to Equity |
||
Correction of Errors |
$ (32) |
$ 404 |
Change in Accounting Principles |
- |
- |
Total |
$ (32) |
404 |
Note 21. Custodial Activity
The Administration for Children and Families receives monies from the Internal Revenue Service for outlay to the states for child support. These monies represent delinquent child support payments withheld from Federal tax refunds. Receipts are transferred to HHS appropriation 75X6234 to cover outlays. During FY 2005, receipts amounted to $1,573 million ($1,489 million for FY 2004) and outlays amounted to $1,562 million ($1,480 million for FY 2004).
Note 21. Custodial Activity (continued)
The Food and Drug Administration (FDA) custodial activity involves collections of civil monetary penalties (CMP) assessed by the Department of Justice on behalf of FDA. Penalties are assessed for violations in areas such as illegally manufactured, marketed, and distributed animal feeds and drug products. Total CMP collections in FY 2005 were $4.7 million ($51 million for FY 2004). CMP collections are immediately forwarded to the Department of Treasury and cannot be used for FDA operations.
The Centers for Disease Control and Prevention (CDC) custodial activity consists of collections of interest on outstanding receivables and funds received from debts in collection status. Total custodial liabilities for FY 2005 and FY 2004 were $84 thousand and $20 thousand, respectively. CDC custodial collections are also forwarded to the Department of Treasury and cannot be used for CDC operations.
Note 22. Federal Matching Contribution
Supplemental Medical Insurance (SMI) benefits and administrative expenses are financed by monthly premiums, which are paid by Medicare beneficiaries and which are matched by the Federal Government through the general fund appropriation, Payments to the Health Care Trust Funds. Section 1844 of the Social Security Act authorizes appropriated funds to match SMI premiums collected and outlines both the ratio for the match as well as the method to make the trust funds whole if insufficient funds are available in the appropriation to match all premiums received in the fiscal year. The monthly SMI premium per beneficiary was $66.60 from October 2004 through December 2004 and $78.20 from January 2005 through September 2005. Premiums collected from beneficiaries totaled $35.9 billion in FY 2005 ($30.3 billion in FY 2004) and were matched by $113.5 billion ($96.7 billion in FY 2004) contribution from the Federal Government.
Note 23. Contingencies
The Department and its components are parties to various administrative proceedings, legal actions, and claims brought by or against it. These contingencies arise in the normal course of operations and their ultimate disposition is unknown. The likelihood that the future event or events will confirm the loss or the incurrence of a liability can range from probable to remote. SFFAS No.5, as amended by SFFAS No. 12, contains the criteria for recognition and disclosure of contingent liabilities. To the extent that a past transaction or event has occurred, a future outflow or other sacrifice of resources is probable, and the related future outflow or sacrifice of resources is measurable, a contingent liability will be accrued and reported in Note 16, Other Liabilities. In respect to all other contingencies, management, in consultation with legal counsel, has determined that it is reasonably possible that certain claims may result in an adverse outcome to the Department. However, an estimate of the range of possible liability cannot be determined. Based on information currently available, it is management’s opinion that the expected outcome of these matters, individually or in the aggregate, will not have a material adverse effect on the financial statements of the Department.
Obligations Related to Cancelled Appropriations
Payments may be required of up to 1 percent of current year appropriations for valid obligations incurred against prior year appropriations that have been cancelled. The total payments related to cancelled appropriations are estimated at $1,136 million and $1,047 million as of September 30, 2005 and 2004, respectively.
Note 24. Apportionment Categories of Obligations Incurred
Obligations incurred by apportionment categories at September 30, 2005 and 2004 are summarized below:
2005 |
|||
|---|---|---|---|
(Dollars in Millions) |
Direct |
Reimbursable |
Totals |
Category A |
$ 89,605 |
$ 5,466 |
$ 95,071 |
Category B |
332,565 |
1,398 |
333,963 |
Exempt from apportionment |
346,601 |
- |
346,601 |
Total Obligations Incurred |
$ 768,771 |
$ 6,864 |
$ 775,635 |
2004 |
|||
|---|---|---|---|
(Dollars in Millions) |
Direct |
Reimbursable |
Totals |
Category A |
$ 83,148 |
$ 4,540 |
$ 87,688 |
Category B |
305,656 |
892 |
306,548 |
Exempt from apportionment |
307,851 |
- |
307,851 |
Total Obligations Incurred |
$ 696,655 |
$ 5,432 |
$ 702,087 |
Obligations Incurred consist of expended authority and the change in undelivered orders. Current system limitations prevent CMS from reporting the recoveries of prior year obligations. The Office of Management and Budget (OMB) has exempted CMS from the Circular No. A-11 requirement to report the refunds of prior year obligations separately from refunds of current year obligations on the SF-133. OMB has mandated that CMS report all Medicare cash collections as an offsetting receipt beginning in FY 2005. Therefore, CMS has reported $2.5 billion as an offsetting receipt in the financial statements for FY 2005.
Note 25. Legal Arrangements Affecting Use of Unobligated Balances
Unobligated balances consist of appropriated funds, revolving funds, management funds, trust funds, Cooperative Research and Development Agreement (CRADA) funds and royalty funds. Annual appropriations are available for new obligations in the year the appropriation was received and for adjustments to valid obligations for five (5) subsequent years. Revolving funds are no-year funds without any time limit. The National Institutes of Health Management Fund is available for two (2) fiscal years. The trust funds are also no-year funds without time limits. CRADA funds are available for the performance of the contractual agreement.
Note 25. Legal Arrangements Affecting Use of Unobligated Balances (continued)
Trust fund receipts collected by CMS in the fiscal year that exceeds the amount needed to pay benefits and other valid obligations in the fiscal year is precluded by law from being available for obligation. CMS reported $11,150 million and $3,921 million at September 30, 2005 and 2004, respectively. This excess of receipts over obligations is reported as “Temporarily Not Available Pursuant to Public Law” in the Statement of Budgetary Resources and, therefore, is not classified as budgetary resources in the fiscal year collected. However, all such excess receipts are assets of the trust funds and currently become available for obligation as needed.
FDA has a Contingency Fund that was established in FY 1983 whereby funds are to be used for unusual direct costs of product emergencies. The remaining balance of $1 million was obligated in FY 2003 and the fund is now inactive.
FDA received $168 million in funding in FY 2002 to remain available until expended, to support Counter Terrorism projects that recognize the important role FDA plays in protecting the public health. The attacks of September 11, 2001 and subsequent national events resulted in an accelerated and intensified need for attention to activities related to counter terrorism. The amount obligated for counter terrorism projects through FY 2005 was approximately $150 million.
Note 26. Explanation of Differences Between the Statement of Budgetary Resources (SBR) and the Budget of the United States Government
SFFAS No. 7, Accounting for Revenue and Other Financing Sources, requires for explanations of any material differences between the information required by paragraph 77 (of SFFAS No. 7) and the amounts described as “Actual” in the “Budget of the United States Government” (also called the “President’s Budget”). Paragraph 77 of the SFFAS No. 7 requires for the presentation of total budgetary resources available to a reporting entity, the status of those resources, and any outlays of the reporting entity. This information is provided in the Department’s SBR.
Chapter 11, Title 31, U.S. Code requires: "On or after the first Monday in January but not later than the first Monday in February of each year, the President shall submit a budget of the United States Government for the following fiscal year." The FY 2007 President’s Budget, with actual amounts for FY 2005, has not yet been published, and therefore no comparisons can be made between FY 2005 amounts presented in the SBR with amounts reported in the “Actual” column of the President’s Budget. The FY 2007 President’s Budget is expected to be released in February 2006, and may be obtained from the OMB website http://www.whitehouse.gov/omb/budget or the Government Printing Office.
The Budget of the United States Government, FY 2006 - Appendix for the HHS, was used as the reference for the Total Budgetary Resources amount. Information in the Federal Programs by Agency and the Account in Chapter 27 of the FY 2006 Analytical Perspectives were used as the reference for the Net Outlays (less Offsetting Receipts) amount in the following reconciliation of the SBR to the President’s Budget for FY 2004.
Note 26. Explanation of Differences Between the Statement of Budgetary Resources (SBR) and the Budget of the United States Government (continued)
The reconciliation is disclosed in the following table:
|
2004 |
|
|---|---|---|
(Dollars in Millions) |
Budgetary Resources |
Net Outlays (Less Offsetting Receipts) |
Statement of Budgetary Resources |
$ 721,084 |
$ 543,475 |
Unobligated Balances - Not Available |
(5,226) |
- |
Other |
421 |
(86) |
Budget of the U.S. Government |
$ 716,279 |
$ 543,389 |
For the budgetary resources reconciliation, the amount used from the President’s Budget was the total budgetary resources available for obligation. Therefore, a reconciling item that is contained in the SBR and not in the President’s Budget is the budgetary resources that were not available. This line amount includes expired authority, recoveries, and other amounts included in the SBR that are not included in the President’s Budget. The “Other” line in the table above includes timing and rounding differences between the SBR and the President’s Budget.
Note 27. Explanation of Differences Between Liabilities Not Covered by Budgetary Resources and Components Requiring or Generating Resources in Future Periods
The Components Requiring Resources in Future Periods includes increases in certain liability accounts, such as accrued annual leave, that are also included in the category "Not Covered by Budgetary Resources". In this instance the expense is recorded for the period when the leave is earned and is included as a current period cost on the Statement of Net Cost.
The Balance Sheet uses proprietary accounts to present the balances for "Liabilities Not Covered by Budgetary Resources". An increase in the annual leave liability increases the unfunded liability on the Balance Sheet and the expenses on the Statement of Net Cost. The increase is not included in the Statement of Budgetary Resources since the liability will be paid from future resources. As a result, the Statement of Financing reports "Components Requiring Resources in Future Periods" which includes items such as accrued annual leave to reconcile budgetary resources to net cost.
Note 28. Permanent Indefinite Appropriations
The HHS permanent indefinite appropriations are open ended; that is, the dollar amount is unknown at the time the authority is granted. These appropriations are available for specific purposes without current year action by Congress.
The list below includes the Treasury Fund Symbols that meet the criteria stated above and are considered permanent indefinite appropriations. The list also includes the period of availability (fiscal year or no-year) and the titles of the accounts.
75 0340 (fiscal year) Health Education Assistance Loans Program
75X0350 (no year) Health Centers Loan Program, Health Resources and Services Administration
75X0513 (no year) Payments for Credits Against Health Care Contributions
75X0585 (no year) Taxation on Old-Age, Survivors and Disability Insurance Benefits
75 1552 (fiscal year) Temporary Assistance for Needy Families
75 1553 (fiscal year) Children's Research and Technical Assistance
75X1553 (no year) Children's Research and Technical Assistance
75X4305 (no year) Health Professions Graduate Student Loan Insurance Fund, Liquidating Acct
75X5071 (no year) Operation and Maintenance of Quarters, IHS
75X5145 (no year) Cooperative Research and Development Agreements, NIH
75X5146 (no year) Cooperative Research and Development Agreements, CDC
75X5148 (no year) Cooperative Research and Development Agreements, FDA
75X8073 (no year) Contributions, Indian Health Facilities, IHS
75X8247 (no year) Food and Drug Administration Unconditional Gift Fund
75X8248 (no year) National Institutes of Health Unconditional Gift Fund
75X8249 (no year) Unconditional Gift Fund, Health Resources and Services Administration
75X8250 (no year) Gifts and Donations, Centers for Disease Control
75X8253 (no year) National Institutes of Health Conditional Gift Fund
75X8254 (no year) Conditional Gift Fund, Health Resources and Services Administration
75X8510 (no year) Administration on Aging Gift Fund
75X8511 (no year) Indian Health Service Gift Fund
75X8512 (no year) Agency for Healthcare Research and Quality Gift Fund
75X8513 (no year) Substance Abuse and Mental Health Administration Gift Fund
75X8514 (no year) Office of the Secretary Gift Fund
75X8888 (no year) Patients Benefit Fund, National Institutes of Health
75X8889 (no year) Patients Benefit Fund, Health Resources and Services Administration
7520X8004 (no year) Federal Supplementary Medical Insurance Trust Fund
7520X8005 (no year) Federal Hospital Insurance Trust Fund
7520X8175 (no year) Vaccine Injury Compensation Trust Fund
Note 29. Adjustments to Beginning Balance of Budgetary Resources
During FY 2004, FDA accelerated the billing and collection of FY 2005 advanced fees from the drug industry. The fees collected in advance were unavailable in FY 2004 and did not become available until the beginning of FY 2005 after the passage of the FDA appropriation. The collection of these advances is authorized by the Prescription Drug User Fee Act of 1992 and re-authorized by the Prescription Drug User Fee Amendments of 2002 (Title 5 of the Public Health Security and Bioterrorism Preparedness and Response Act of 2002 (Public Law 107-188).
As a result of collecting the fees in advance, FDA adjusted the beginning of the year budgetary resources available balance in their SBR for FY 2005. This resulted in a $164 million difference in the ending unobligated balance for FY 2004 and the beginning unobligated balance for FY 2005.
HHS has two types of property, plant, and equipment (PP&E) for stewardship reporting: Heritage Assets and Indian Trust Lands.
Heritage Assets are PP&E of historical, natural, cultural, educational, or artistic significance. Heritage Assets are generally expected to be preserved indefinitely. This category includes buildings on the National Historic Register, cemetery sites, etc.
Stewardship Land includes land and land rights other than that acquired for or in connection with general PP&E. “Land” is defined as the solid part of the surface of the earth, excluding natural resources related to land. Examples of Stewardship Land include land used as forests and parks, and land used for wildlife and grazing.
Indian Trust Lands are those lands that do not meet the definition of Stewardship Land, but are held by IHS as separate and distinct, because of the Federal Government’s long-term trust responsibility. All Indian Trust lands, when no longer needed by IHS in connection with its General PP&E, must be returned to the Department of the Interior’s Bureau of Indian Affairs for continuing trust responsibility and oversight. IHS separately reports Indian Trust land parcels by site and installation numbers, and Indian Trust Lands from General PP&E situated thereon.
IHS Stewardship Classes and Trust Land |
||||
|---|---|---|---|---|
Number |
Total Square |
Federal |
Total |
|
Asset Descriptions |
of Sites |
Footage |
Hectares |
Hectares |
Heritage Assets |
2 |
2,295 |
<1.82 (4+/- acres) |
<1.82 (4+/- acres) |
Indian Trust Lands |
79 |
N/A |
424.9 (1,049 acres) |
424.9 (1,049acres) |
Distribution of Stewardship Assets by Type and Area
Heritage Assets |
Indian Trust Lands |
||||
|---|---|---|---|---|---|
Number |
Square |
Total |
Number |
Total |
|
of Sites |
Footage |
Hectares |
Of Sites |
Hectares |
|
Aberdeen |
9 |
75 |
|||
Alaska |
1 |
< 1.82 |
|||
Albuquerque |
4 |
4 |
|||
Bemidji |
2 |
9 |
|||
Billings |
7 |
48 |
|||
Navajo |
35 |
255 |
|||
Oklahoma City |
1 |
2 |
|||
Phoenix |
1 |
2,295 |
13 |
19 |
|
Portland |
3 |
1 |
|||
Tucson |
5 |
12 |
|||
Total IHS |
2 |
2,295 |
< 1.82 |
79 |
425 |
U.S. Department of Health and Human Services
Investment in Human Capital
For the Year Ended September 30, 2005
RESPONSIBILITY SEGMENT |
2005 |
2004 |
2003 |
2002 |
2001 |
|---|---|---|---|---|---|
ACF |
|||||
Administration on Developmental Disabilities |
$8 |
$9 |
$10 |
$6 |
$6 |
NIH |
|||||
Research Training and Career Development |
1,699 |
1,696 |
1,405 |
1,248 |
1,118 |
Totals |
$1,707 |
$1,705 |
$1,415 |
$1,254 |
$1,124 |
“Investments in Human Capital” are expenses incurred by Federal education and training programs for the public, which are intended to maintain or increase national productive capacity. Two operating divisions of the Department conduct education and training programs under this category: Administration for Children and Families, and the National Institutes of Health.
Administration for Children and Families (ACF)
ACF is able to estimate investment in human capital for the Administration for Developmental Disabilities (ADD) using existing data collection activities. Under ADD, 53 grants were awarded for Projects of National Significance (PNS). PNS grants are awarded to public or private, non-profit institutions to enhance the independence, productivity, integration and inclusion into the community of people with developmental disabilities. Monies also support the development of national and state policy to serve this community. Grants awarded total $8 million in FY 2005 and $9 million in FY 2004.
National Institutes of Health (NIH)
The NIH Research Training and Career Development Program addresses the need for trained personnel to conduct medical research. The primary goal of the support that NIH provides for graduate training and career development is to produce new, highly trained investigators who are likely to perform research that will benefit the Nation’s health. Our ability to maintain the momentum of recent scientific progress and our international leadership in medical research depends upon the continued development of new, highly trained investigators.
U.S. Department of Health and Human Services
Investment in Research and Development
For the Year Ended September 30, 2005
Responsibility Segments |
2005 Basic |
2005 Applied |
2005 Develop- |
2005 |
2004 |
2003 |
2002 |
2001 |
Grand Total |
|---|---|---|---|---|---|---|---|---|---|
ACF |
$21 |
$21 |
$21 |
$24 |
$29 |
$32 |
$127 |
||
AHRQ |
162 |
162 |
170 |
163 |
150 |
127 |
772 |
||
CDC |
521 |
521 |
549 |
557 |
533 |
557 |
2,717 |
||
FDA * |
26 |
5 |
31 |
28 |
31 |
29 |
26 |
145 |
|
HRSA |
23 |
23 |
16 |
16 |
16 |
16 |
87 |
||
NIH |
15,192 |
10,128 |
25,320 |
23,700 |
21,359 |
19,058 |
16,007 |
105,444 |
|
Totals |
$15,354 |
$10,719 |
$5 |
$26,078 |
$24,484 |
$22,150 |
$19,815 |
$16,765 |
$109,292 |
*FDA restated its FY 2003 amount by 1 as compared to their FY 2003 statements.
The many research and development programs in HHS include the following:
FDA has two programs that meet the requirements of research and development investments: Orphan Products Development (OPD) Program and FDA Research Grants Program. While FDA’s center components conduct scientific studies, FDA does not consider this type of research as “research and development” because it is used to support FDA’s regulatory policy and decision-making processes.
The OPD Program was established by the Orphan Drug Act (Public Law 97-414, as amended) with the purpose of identifying orphan products and facilitating their development. An orphan product is a drug, biological product, medical device, or medical food that is intended to treat a rare disease or condition (i.e., one with a prevalence of fewer than 200,000 people in the United States.)
The FDA Research Grants Program is a grants program which is listed as No. 93-103 under the Catalog of Federal Domestic Assistance, whose purpose is to assist public and non-public institutions and for-profit organizations to establish, expand, and improve research, demonstration, education, and information dissemination activities concerned with a wide variety of FDA areas.
Infectious Diseases, Occupational Safety and Health, Health Promotion, and Environmental Health and Injury Prevention were the primary areas where CDC’s research and development was invested.
The NIH Research Program includes all aspects of the medical research continuum, including basic and disease-oriented research, observational and population-based research, behavioral research, and clinical research, including research to understand both health and disease states, to move laboratory findings into medical applications, to assess new treatments or compare different treatment approaches; and health services research. NIH regards the expeditious transfer of the results of its medical research for further development and commercialization of products of immediate benefit to improved health as an important mandate.
ACF, HRSA and AHRQ oversee research and development programs that contribute to a better understanding of how to improve the economic and social well being of families and children so that they lead more healthy and productive lives.
U.S. Department of Health and Human Services Social Insurance For the Year Ended September 30, 2005
Medicare, the largest health insurance program in the country, has helped fund medical care for the Nation’s aged and disabled for four decades. The recent Medicare Prescription Drug, Improvement, and Modernization Act of 2003 (known informally as the Medicare Modernization Act, or MMA) introduced the most sweeping changes to the program since its enactment in 1965. The most significant change is that, beginning in 2004, the MMA established a new prescription drug benefit. A separate Part D account within the SMI trust fund will handle the transactions for this new coverage. A brief description of the provisions of Medicare’s Hospital Insurance (HI, or Part A) trust fund and Supplementary Medical Insurance (SMI, or Parts B and D) trust fund is included on pages III.C.4 to III.C.7 of this report.
The required supplementary stewardship information (RSSI) contained in this section is presented in accordance with the requirements of the Federal Accounting Standards Advisory Board (FASAB). Included are a description of the long-term sustainability and financial condition of the program and a discussion of trends revealed in the data.
CMS’ RSSI material is generally drawn from the 2005 Annual Report of the Boards of Trustees of the Federal Hospital Insurance and Federal Supplementary Medical Insurance Trust Funds, which represents the official government evaluation of the financial and actuarial status of the Medicare trust funds. Unless otherwise noted, all data are for calendar years, and all projections are based on the Trustees’ intermediate set of assumptions.
Printed copies of the Trustees Report may be obtained from the CMS Office of the Actuary (410-786-6386) or can be downloaded from www.cms.hhs.gov/pub lications/trusteesreport/default.asp.
Cashflow in Nominal Dollars
Using nominal dollars1 for short-term projections paints a reasonably clear picture of expected performance with particular attention on cashflow and trust fund balances. Over longer periods, however, the changing value of the dollar can complicate efforts to compare dollar amounts in different periods and can create severe barriers to interpretation, since projections must be linked to something that can be reasonably comprehended in today’s experience.
For this reason, long-range (75-year) Medicare projections in nominal dollars are seldom used and are not presented here. Instead, nominal-dollar estimates for the HI trust fund are displayed only through the projected date of depletion, currently the year 2020. Estimates for SMI Parts B and D are presented only for the next 10 years, primarily due to the fact that under present law, the SMI trust fund is automatically in financial balance every year.
HI
Chart 1 shows the actuarial estimates of HI income, expenditures, and assets for each of the next 16 years, in nominal dollars. Income includes payroll taxes, income from the taxation of Social Security benefits, interest earned on the U.S. Treasury securities held by the trust fund, and other miscellaneous revenue. Expenditures include benefit payments and administrative expenses. The estimates are for the “open group” population�all persons who will participate during the period as either HI taxpayers or beneficiaries, or both�and consist of payments from, and on behalf of, employees now in the workforce, as well as those who will enter the workforce over the next 16 years. The estimates also include income and expenditures attributable to these current and future workers, in addition to current beneficiaries.
The estimates also include income and expenditures attributable to these current and future workers, in addition to current beneficiaries.
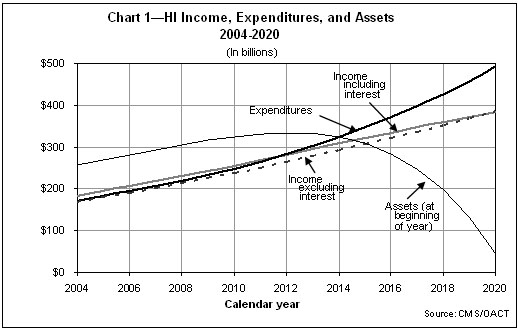
As Chart 1 shows, HI expenditures exceeded income excluding interest in 2004 and, under the intermediate assumptions, would begin to exceed income including interest in 2012. This situation arises as a result of health cost increases that are expected to continue to grow faster than workers’ earnings. Beginning in 2012, the trust fund would start redeeming trust fund assets; by the end of 2020, the assets would be depleted�1 year later than estimated in the 2004 Trustees Report. For the second year in a row, the HI trust fund does not meet an explicit test of short-range financial adequacy, as assets are predicted to fall below expenditures within the next 10 years.
The projected year of depletion of the trust fund is very sensitive to assumed future economic and other trends. Under less favorable conditions the cash flow could turn negative much earlier and thereby accelerate asset exhaustion.
By law, Medicare trust fund assets are invested in special U.S. Treasury Securities, which earn interest while Treasury uses those cash resources for other Federal purposes. During times of Federal “on-budget” surpluses, this process reduces the Federal debt held by the public. In times of Federal budget deficits, Medicare surpluses reduce the amount that must be borrowed from the public to finance those deficits. The trust fund assets are claims on the Treasury that, when redeemed, will have to be financed by raising taxes, borrowing from the public, or reducing other Federal expenditures. (When the assets are financed by borrowing, the effect is to defer today’s costs to later generations who will ultimately repay the funds being borrowed for today’s Medicare beneficiaries.) The existence of large trust fund balances, therefore, represents an important obligation of the government to pay future Medicare benefits but does not necessarily make it easier for the government to pay those benefits.
SMI
Chart 2 shows the actuarial estimates of SMI income, expenditures, and assets, for Parts B and D combined, for each of the next 10 years, in nominal dollars. Whereas HI estimates are displayed through the year 2020, SMI estimates cover only the next 10 years, as SMI differs fundamentally from HI in regard to the way it is financed. In particular, financing for SMI Parts B and D is not based on payroll taxes but rather on a combination of monthly beneficiary premiums and income from the general fund of the U.S. Treasury�both of which are established annually to cover the following year’s expenditures.2 Estimates of SMI income and expenditures, therefore, are virtually the same, as illustrated in Chart 2, and so are not shown in nominal dollars separately beyond 10 years.3
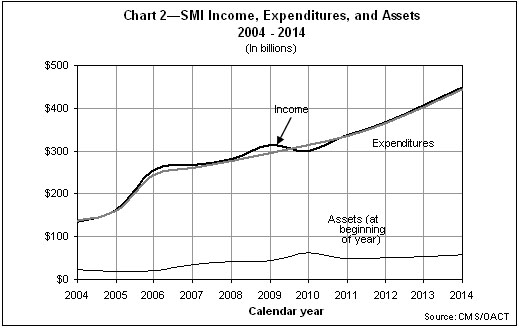
Income includes monthly premiums paid by, or on behalf of, beneficiaries, transfers from the general fund of the U.S. Treasury, certain payments by the States to the Part D account, and interest earned on the U.S. Treasury securities held by the trust fund.4 Chart 2 displays only total income; it does not separately show income excluding interest. The difference between the two depictions of income is not visible graphically since interest is not a significant source of income.5 Expenditures include benefit payments as well as administrative expenses.
As Chart 2 indicates, SMI income is very close to expenditures. As mentioned earlier, this is because of the financing mechanism for Parts B and D. Under present law, both accounts are automatically in financial balance every year, regardless of future economic and other conditions.
It should be noted that the projected Part B expenditure and income growth is unrealistically low, due to the structure of physician payment updates under current law. This structure will result in multiple years of significant reductions in physician payments per service, though such reductions are very unlikely to occur before legislative changes intervene. But since these reductions are required under the current law payment system, they are reflected in this report. Consequently, the current law Part B projections shown are very likely to understate actual future expenditures in 2006 and later. Nevertheless, because of the financing mechanism for Part B, its income and expenditures will still be equivalent.
In addition to the inherent variability that underlies the cost projections prepared for all parts of Medicare, the Part D projections have an added uncertainty in that they were prepared for a new benefit, so there is no current program experience upon which to base the estimates. Accordingly, there is a very substantial level of uncertainty surrounding these cost projections.
HI Cashflow as a Percentage of Taxable Payroll
Each year, estimates of the financial and actuarial status of the HI trust fund are prepared for the next 75 years. Because of the difficulty in meaningfully comparing dollar values for different periods without some type of relative scale, income and expenditure amounts are shown relative to the earnings in covered employment that are taxable under HI (referred to as “taxable payroll”).
Chart 3 illustrates income (excluding interest) and expenditures as a percentage of taxable payroll over the next 75 years. The long-range increase in average expenditures per beneficiary is assumed to equal growth in per capita gross domestic product (GDP) plus 1 percentage point�reflecting an expectation that the impact of advances in medical technology on health care costs will continue, both in Medicare and in the health sector as a whole.
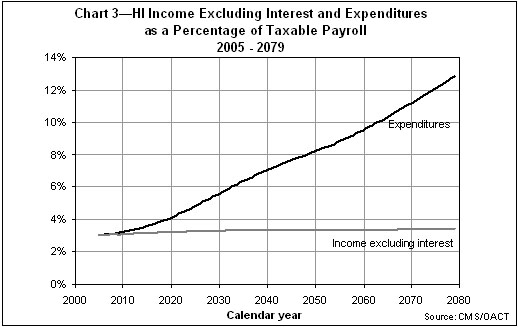
Since HI payroll tax rates are not scheduled to change in the future under present law, payroll tax income as a percentage of taxable payroll is estimated to remain constant at 2.90 percent. Income from taxation of benefits will increase only gradually as a greater proportion of Social Security beneficiaries become subject to such taxation over time. Thus, as Chart 3 shows, the income rate is not expected to increase significantly over current levels. On the other hand, expenditures as a percentage of taxable payroll sharply escalate�in part due to health care cost increases that exceed wage growth, but also due to the attainment of Medicare eligibility of those born during the 1946-1964 baby boom.
HI and SMI Cashflow as a Percentage of GDP
Expressing Medicare incurred expenditures as a percentage of GDP gives a relative measure of the size of the Medicare program compared to the general economy. The GDP represents the total value of goods and services produced in the United States. This measure provides an idea of the relative financial resources that will be necessary to pay for Medicare services.
HI
Chart 4 shows HI income (excluding interest) and expenditures over the next 75 years expressed as a percentage of GDP. In 2004, the expenditures were $170.6 billion, which was 1.5 percent of GDP. This percentage is projected to increase steadily throughout the remainder of the 75-year period.
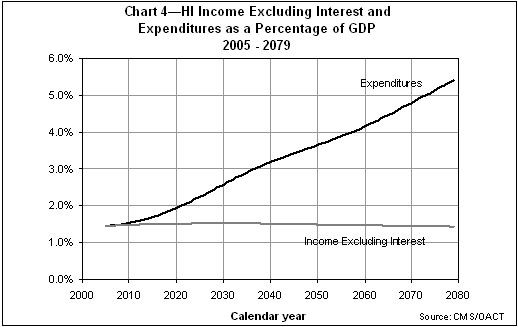
SMI
Because of the Part B and Part D financing mechanism in which income mirrors expenditures, it is not necessary to test for long-range imbalances between income and expenditures. Rather, it is more important to examine the projected rise in expenditures and the implications for beneficiary premiums and Federal general revenue payments.
Chart 5 shows projected total SMI (Part B and Part D) expenditures and premium income as a percentage of GDP. As in the projections for HI, the long-range increase in average expenditures per beneficiary is assumed to equal growth in per capita GDP plus 1 percentage point. The growth rates are estimated year by year for the next 12 years, reflecting the impact of specific statutory provisions. Expenditure growth for years 13 to 25 is assumed to grade smoothly into the long-range assumption.
Under the intermediate assumptions, annual SMI expenditures would grow from about 1.2 percent of GDP in 2004 to 1.9 percent of GDP in 2006 with the commencement of the full prescription drug coverage. Then, within 25 years, they would grow to 4 percent of GDP and to more than 8 percent by the end of the projection period.
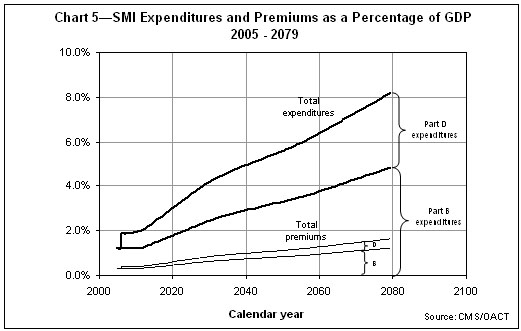
To match the faster growth rates for SMI expenditures, beneficiary premiums, along with general revenue contributions, would increase more rapidly than GDP over time. In fact, average per-beneficiary costs for Part B and Part D benefits are projected to increase in most years by at least 5 percent annually. The associated beneficiary premiums�and general revenue financing�would increase by approximately the same rate. The special state payments to the Part D account are set by law at a declining portion of the States’ forgone Medicaid expenditures attributable to the new Medicare drug benefit. The percentage is 90 percent in 2006, phasing down to 75 percent in 2015 and later. Then, after 2015, the State payments are also expected to increase faster than GDP.
Worker-to-Beneficiary Ratio
HI
Another way to evaluate the long-range outlook of the HI trust fund is to examine the projected number of workers per HI beneficiary. Chart 6 illustrates this ratio over the next 75 years. For the most part, current benefits are paid for by current workers. The retirement of the baby boom generation will therefore be financed by the relatively smaller number of persons born after the baby boom. In 2004, every beneficiary had almost 4.0 workers to pay for his or her benefit. In 2030, however, after the last baby boomer turns 65, there will be only about 2.4 workers per beneficiary. The projected ratio continues to decline until there are just 2.0 workers per beneficiary in about 2055 and later.
Actuarial Present Values
Projected future expenditures can be summarized by computing an “actuarial present value.” This value represents the lump-sum amount that, if invested today in trust fund securities, would be just sufficient to pay each year’s expenditures over the next 75 years, with the fund being drawn down to zero at the end of the period. Similarly, future revenues (excluding interest) can be summarized as a single, equivalent amount as of the current year.
Actuarial present values are calculated by discounting the future annual amounts of non-interest income and expenditures at the assumed rates of interest credited to the HI and SMI trust funds. Present values are computed as of the beginning of the 75-year projection period for three different groups of participants: current workers and other individuals who have not yet attained eligibility age; current beneficiaries who have attained eligibility age; and new entrants, or those who are expected to become participants in the future.
Table 1 sets forth, for each of these three groups, the actuarial present values of all future HI (Part A) and SMI (Part B and Part D) expenditures and all future non-interest income for the next 75 years. Also shown is the net present value of cashflow, which is calculated by subtracting the actuarial present value of future expenditures from the actuarial present value of future income. Present values are shown (where available) based on each of the last five Trustees Reports. For each year shown, the present values are calculated as of January 1 of that year.
|
Table 1�Actuarial Present Values of |
||||||||||||||||
|---|---|---|---|---|---|---|---|---|---|---|---|---|---|---|---|---|
SMI2 |
||||||||||||||||
HI |
Part B |
Part D |
||||||||||||||
2005 |
2004 |
2003 |
2002 |
2001 |
2005 |
2004 |
2003 |
2002 |
2001 |
2005 |
2004 |
2003 |
2002 |
2001 |
||
Actuarial present value1 of estimated future income (excluding interest) received from or on behalf of: |
||||||||||||||||
Current participants3 who, at start of projection period: |
||||||||||||||||
Have not yet attained eligibility age (ages 15-64) |
$5,064 |
$4,820 |
$4,510 |
$4,408 |
$4,136 |
$11,477 |
$10,505 |
$8,796 |
$7,423 |
$7,378 |
$7,895 |
$7,545 |
� |
� |
� |
|
Have attained eligibility age (age 65 and over) |
162 |
148 |
128 |
125 |
113 |
1,436 |
1,310 |
1,160 |
1,008 |
1,032 |
817 |
713 |
� |
� |
� |
|
Those expected to become participants (under age 15) |
4,209 |
4,009 |
3,773 |
3,753 |
3,507 |
3,658 |
3,514 |
2,817 |
2,402 |
2,370 |
2,522 |
2,511 |
� |
� |
� |
|
All current and future participants |
9,435 |
8,976 |
8,411 |
8,286 |
7,757 |
16,571 |
15,329 |
12,773 |
10,833 |
10,780 |
11,233 |
10,770 |
� |
� |
� |
|
Actuarial present value1 of estimated future expenditures4 paid to or on behalf of: |
||||||||||||||||
Current participants3 who, at start of projection period: |
||||||||||||||||
Have not yet attained eligibility age (ages 15-64) |
12,668 |
12,054 |
10,028 |
9,195 |
8,568 |
11,541 |
10,577 |
8,845 |
7,463 |
7,415 |
7,913 |
7,566 |
� |
� |
� |
|
Have attained eligibility age (age 65 and over) |
2,179 |
2,168 |
1,897 |
1,747 |
1,693 |
1,622 |
1,475 |
1,306 |
1,132 |
1,159 |
880 |
773 |
� |
� |
� |
|
Those expected to become participants (under age 15) |
3,417 |
3,246 |
2,653 |
2,470 |
2,225 |
3,408 |
3,277 |
2,622 |
2,238 |
2,206 |
2,440 |
2,431 |
� |
� |
� |
|
All current and future participants |
18,264 |
17,468 |
14,577 |
13,412 |
12,487 |
16,571 |
15,329 |
12,773 |
10,833 |
10,780 |
11,233 |
10,770 |
� |
� |
� |
|
Actuarial present value1 of estimated future income (excluding interest) less expenditures |
-8,829 |
-8,492 |
-6,166 |
-5,126 |
-4,730 |
0 |
0 |
0 |
0 |
0 |
0 |
0 |
� |
� |
� |
|
Trust fund assets at start of period |
268 |
256 |
235 |
209 |
177 |
19 |
24 |
34 |
41 |
44 |
0 |
0 |
� |
� |
� |
|
Assets at start of period plus actuarial present value1 of estimated future income (excluding interest) less expenditures |
-8,561 |
-8,236 |
-5,931 |
-4,917 |
-4,553 |
19 |
24 |
34 |
41 |
44 |
0 |
0 |
� |
� |
� |
|
HI actuarial present value of estimated future taxable payroll |
286,019 |
272,352 |
256,370 |
254,065 |
240,971 |
n/a |
n/a |
n/a |
n/a |
n/a |
n/a |
n/a |
� |
� |
� |
|
Assets plus actuarial present value of future income less expenditures as a percent of future taxable payroll (HI “actuarial balance”) |
3.09% |
3.12% |
2.40% |
2.02% |
1.97% |
n/a |
n/a |
n/a |
n/a |
n/a |
n/a |
n/a |
� |
� |
� |
|
|
1 Present values are computed on the basis of the intermediate set of economic and demographic assumptions specified in the Report of the Boards of Trustees for the year shown and over the 75-year projection period beginning January 1 of that year. Note: Totals do not necessarily equal the sums of rounded components. |
||||||||||||||||
As shown in table 1, the HI trust fund has an actuarial deficit6 of almost $8.6 trillion over the 75-year projection period, as compared to about $8.2 trillion in the CMS 2004 Financial Report. On the other hand, neither Part B nor Part D of SMI has similar problems because each account is automatically in financial balance every year due to its financing mechanism.7
The existence of a large actuarial deficit for the HI trust fund indicates that, under reasonable assumptions as to economic, demographic, and health cost trends for the future, HI income is expected to fall substantially short of expenditures in the long range. Although the deficits are not anticipated in the immediate future, as indicated by the preceding cashflow projections, they nonetheless pose a serious financial problem for the HI trust fund.
A figure as large as $8.6 trillion can be difficult to interpret without some relative basis of comparison. To put this number in perspective, it is helpful to consider that the present value of future taxable payroll over the same 75-year period is estimated to be $286 trillion in the 2005 Trustees Report. Thus, the $8.6-trillion deficit represents approximately 3.0 percent of future taxable payroll.
As indicated in Table 1, there has been substantial growth in the present values from one valuation period to the next. Much of this growth, however, is attributable to using a new valuation period each year.8> The remainder reflects any changes in assumptions, methods, and/or base-year data that have been incorporated into the estimates. The impact of the changing valuation period can be largely eliminated by using the relative estimates. As indicated in the table, the 75-year actuarial deficit has increased from 1.97 percent of taxable payroll in the 2001 Trustees Report to 3.09 percent in the most recent report.
It is important to note that no liability has been recognized on the balance sheet for future payments to be made to current and future program participants beyond the existing “incurred but not reported” Medicare claim amounts as of September 30, 2005. This is because Medicare is accounted for as a social insurance program rather than a pension program. Accounting for a social insurance program recognizes the expense of benefits when they are actually paid, or are due to be paid, because benefit payments are primarily non-exchange transactions and, unlike employer-sponsored pension benefits for employees, are not considered deferred compensation. Accrual accounting for a pension program, by contrast, recognizes retirement benefit expenses as they are earned so that the full actuarial present value of the worker’s expected retirement benefits has been recognized by the time the worker retires.
Actuarial Assumptions and Sensitivity Analysis
In order to make projections regarding the future financial status of the HI and SMI trust funds, various assumptions have to be made. First and foremost, the estimates presented here are based on the assumption that the trust funds will continue under present law. In addition, the estimates depend on many economic and demographic assumptions, including changes in per beneficiary cost, wages and the consumer price index (CPI), fertility rates, immigration rates, and interest rates. In most cases, these assumptions vary from year to year during the first 5 to 30 years before reaching their ultimate values for the remainder of the 75-year projection period.
Table 2 shows the most significant underlying assumptions used in the projections of Medicare spending displayed in this section. Further details on these assumptions are available in the Social Security and Medicare Trustees Reports for 2005. In practice, a number of specific assumptions are made for each of the different types of service provided by the Medicare program (for example, hospital care and physician services). These assumptions include changes in the payment rates, utilization, and intensity of each type of service. The per beneficiary cost increases displayed in Table 2 reflect the overall impact of these more detailed assumptions.
Table 2�Medicare Assumptions |
||||||||||
|---|---|---|---|---|---|---|---|---|---|---|
Fertility rate1 |
Net immigration |
Real-wage differential2 |
Annual percentage change in: |
Real-interest rate4 |
||||||
Wages |
CPI |
Real GDP |
Per beneficiary cost3 |
|||||||
HI |
SMI |
|||||||||
B |
D |
|||||||||
2005 |
2.02 |
1,075,000 |
2.1 |
4.2 |
2.2 |
3.6 |
5.4 |
6.6 |
� |
2.0 |
2010 |
2.01 |
1,000,000 |
1.3 |
4.1 |
2.8 |
2.5 |
4.3 |
3.2 |
7.0 |
2.9 |
2020 |
1.98 |
950,000 |
1.1 |
3.9 |
2.8 |
1.9 |
4.3 |
5.4 |
6.5 |
3.0 |
2030 |
1.95 |
900,000 |
1.1 |
3.9 |
2.8 |
1.8 |
5.5 |
5.2 |
4.9 |
3.0 |
2040 |
1.95 |
900,000 |
1.1 |
3.9 |
2.8 |
1.9 |
5.7 |
5.2 |
5.1 |
3.0 |
2050 |
1.95 |
900,000 |
1.1 |
3.9 |
2.8 |
1.8 |
5.1 |
5.0 |
5.1 |
3.0 |
2060 |
1.95 |
900,000 |
1.1 |
3.9 |
2.8 |
1.8 |
5.2 |
5.2 |
5.1 |
3.0 |
2070 |
1.95 |
900,000 |
1.1 |
3.9 |
2.8 |
1.8 |
5.3 |
5.1 |
5.1 |
3.0 |
2079 |
1.95 |
900,000 |
1.1 |
3.9 |
2.8 |
1.8 |
5.2 |
5.1 |
5.1 |
3.0 |
|
1 Average number of children per woman. |
||||||||||
Estimates made in prior years have sometimes changed substantially because of revisions to the assumptions, which are due either to changed conditions or to more information. Furthermore, it is important to recognize that actual conditions are very likely to differ from the projections presented here, since the future cannot be anticipated with certainty. In order to illustrate the magnitude of the sensitivity of the long-range projections, six of the key assumptions were varied individually to determine the impact on the HI actuarial present values and net cashflows.9 The assumptions varied are the health care cost factors, fertility rate, net immigration, real-wage differential, CPI, and real-interest rate.10
For this analysis, the intermediate economic and demographic assumptions in the 2005 Annual Report of the Boards of Trustees of the Federal Hospital Insurance and Federal Supplementary Medical Insurance Trust Funds are used as the reference point. Each selected assumption is varied individually to produce three scenarios. All present values are calculated as of January 1, 2005 and are based on estimates of income and expenditures during the 75-year projection period.
Charts 7 through 12 show the net annual HI cashflow in nominal dollars and the present value of this net cashflow for each assumption varied. In most instances, the charts depicting the estimated net cashflow indicate that, after increasing in the early years, net cashflow decreases steadily through 2020 under all three scenarios displayed. On the present value charts, the same pattern is evident, though the magnitudes are lower because of the discounting process used for computing present values.
Health Care Cost Factors
Table 3 shows the net present value of cashflow during the 75-year projection period under three alternative assumptions of the annual growth rate in the aggregate cost of providing covered health care services to beneficiaries. These assumptions are that the ultimate annual growth rate in such costs, relative to taxable payroll, will be 1 percent slower than the intermediate assumptions, the same as the intermediate assumptions, and 1 percent faster than the intermediate assumptions. In each case, the taxable payroll will be the same as that which was assumed for the intermediate assumptions.
Table 3�Present Value of Estimated HI Income Less Expenditures under Various Health Care Cost Growth Rate Assumptions |
|||
Annual cost/payroll relative growth rate |
-1 percentage point |
Intermediate assumptions |
+1 percentage point |
Income minus expenditures (in billions) |
-$3,140 |
-$8,829 |
-$18,113 |
Table 3 demonstrates that if the ultimate growth rate assumption is 1 percentage point lower than the intermediate assumptions, the deficit of income versus expenditures decreases by $5,689 billion. On the other hand, if the ultimate growth rate assumption is 1 percentage point higher than the intermediate assumptions, the deficit increases more substantially, by $9,284 billion.
Charts 7 and 7A show projections of the net cashflow under the three alternative annual growth rate assumptions presented in Table 3.

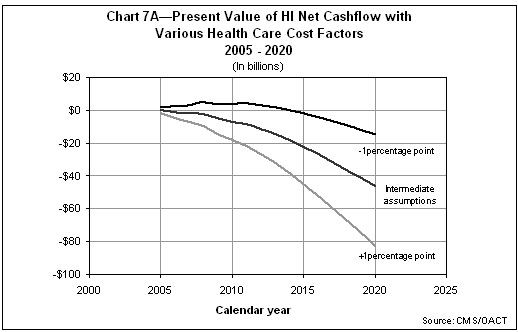
This assumption has a dramatic impact on projected HI cashflow. Several factors, such as the utilization of services by beneficiaries or the relative complexity of services provided, can affect costs without affecting tax income. As Charts 7 and 7A indicate, the financial status of the HI trust fund is extremely sensitive to the relative growth rates for health care service costs.
Fertility Rate
Table 4 shows the net present value of cashflow during the 75-year projection period under three alternative ultimate fertility rate assumptions: 1.7, 1.95, and 2.2 children per woman.
Table 4�Present Value of Estimated HI Income Less Expenditures under Various Fertility Rate Assumptions |
|||
|---|---|---|---|
Ultimate fertility rate1 |
1.7 |
1.95 |
2.2 |
Income minus expenditures (in billions) |
-$8,978 |
-$8,829 |
-$8,677 |
1The total fertility rate for any year is the average number of children who would be born to a woman in her lifetime if she were to experience the birth rates by age observed in, or assumed for, the selected year and if she were to survive the entire childbearing period. |
|||
As Table 4 demonstrates, for an increase of 0.25 in the assumed ultimate fertility rate, the projected deficit decreases by approximately $150 billion.
Charts 8 and 8A show projections of the net cashflow under the three alternative fertility rate assumptions presented in Table 4.

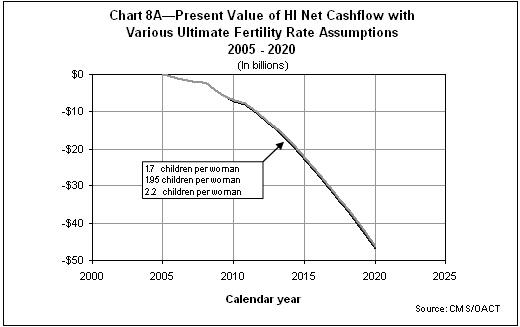
As Charts 8 and 8A indicate, the fertility rate assumption has only a negligible impact on projected HI cashflows over the next 16 years. In fact, higher fertility in the first year does not affect the labor force until roughly 20 years have passed (increasing HI payroll taxes slightly) and has virtually no impact on the number of beneficiaries within this period. Over the full 75-year period, the impacts are expected to be somewhat greater, as illustrated by the present values in Table 4.
Net Immigration
Table 5 shows the net present value of cashflow during the 75-year projection period under three alternative net immigration assumptions: 672,500 persons, 900,000 persons, and 1,300,000 persons per year.
Table 5�Present Value of Estimated HI Income Less Expenditures under Various Net Immigration Assumptions |
|||
Ultimate net immigration |
672,500 |
900,000 |
1,300,000 |
Income minus expenditures (in billions) |
-$8,734 |
-$8,829 |
-$8,982 |
As shown in table 5, if the ultimate net immigration assumption is 672,500 persons, the deficit of income versus expenditures decreases by $95 billion. Similarly, if the ultimate net immigration assumption is 1,300,000 persons, the deficit increases by $153 billion.
Charts 9 and 9A show projections of the net cashflow under the three alternative net immigration assumptions presented in table 5.

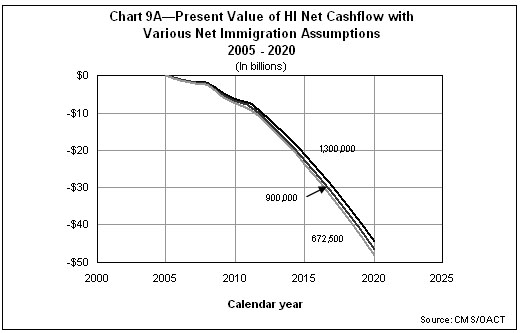
As Charts 9 and 9A indicate, this assumption has an impact on projected HI cashflow starting almost immediately. Because immigration tends to occur among those who work and pay taxes into the system, in the short term payroll taxes increase faster than benefits; in the long term, however, the opposite occurs, as those individuals age and become beneficiaries in a period with much greater health care costs per beneficiary.
Real-Wage Differential
Table 6 shows the net present value of cashflow during the 75-year projection period under three alternative ultimate real-wage differential11 assumptions: 0.6, 1.1, and 1.6 percentage points. In each case, the ultimate CPI-increase is assumed to be 2.8 percent, yielding ultimate percentage increases in average annual wages in covered employment of 3.4, 3.9, and 4.4 percent, respectively.
Table 6�Present Value of Estimated HI Income Less Expenditures under Various Real-Wage Assumptions |
|||
Ultimate percentage increase in wages - CPI |
3.4 - 2.8 |
3.9 - 2.8 |
4.4 -2.8 |
Ultimate percentage increase in real-wage differential |
0.6 |
1.1 |
1.6 |
Income minus expenditures (in billions) |
-$8,303 |
-$8,829 |
-$9,531 |
As indicated in Table 6, for a half-point increase in the ultimate real-wage differential assumption, the deficit decreases by approximately $600 billion.
Charts 10 and 10A show projections of the net cashflow under the three alternative real-wage differential assumptions presented in Table 6.


As Charts 10 and 10A indicate, this assumption has a fairly large impact on projected HI cashflow very early in the projection period. Higher real-wage differential assumptions immediately increase both HI expenditures for health care and wages for all workers. Though there is a full effect on wages and payroll taxes, the effect on benefits is only partial, since not all health care costs are wage-related.
Consumer Price Index
Table 7 shows the net present value of cashflow during the 75-year projection period under three alternative ultimate CPI rate-of-increase assumptions: 1.8, 2.8, and 3.8 percent. In each case, the ultimate real-wage differential is assumed to be 1.1 percent, yielding ultimate percentage increases in average annual wages in covered employment of 2.9, 3.9, and 4.9 percent, respectively.
Table 7�Present Value of Estimated HI Income Less Expenditures under Various CPI-Increase Assumptions |
|||
Ultimate percentage increase in wages - CPI |
2.9 - 1.8 |
3.9 - 2.8 |
4.9 - 3.8 |
Income minus expenditures (in billions) |
-$8,863 |
-$8,829 |
-$8,751 |
Table 7 demonstrates that if the ultimate CPI-increase assumption is 1.8 percent, the deficit increases by $34 billion. On the other hand, if the ultimate CPI-increase assumption is 3.8 percent, the deficit decreases by $78 billion.
Charts 11 and 11A show projections of the net cashflow under the three alternative CPI rate-of-increase assumptions presented in Table 7.
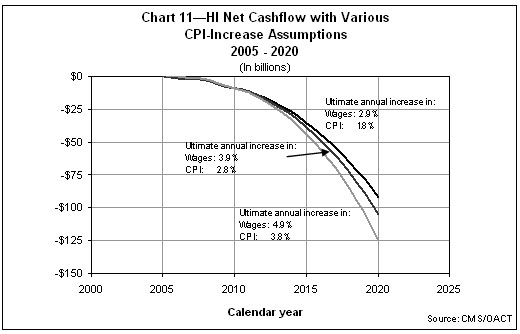

As Charts 11 and 11A indicate, this assumption has a large impact on projected HI cashflow in nominal dollars but only a negligible impact when the cashflow is expressed as present values. The relative insensitivity of the projected present values of HI cashflow to different levels of general inflation occurs because inflation tends to affect both income and costs in a similar manner. In nominal dollars, however, a given deficit “looks bigger” under high-inflation conditions but is not significantly different when it is expressed as a present value or relative to taxable payroll. This sensitivity test serves as a useful example of the limitations of nominal-dollar projections over long periods.
Real-Interest Rate
Table 8 shows the net present value of cashflow during the 75-year projection period under three alternative ultimate real-interest assumptions: 2.2, 3.0, and 3.7 percent. In each case, the ultimate annual increase in the CPI is assumed to be 2.8 percent, resulting in ultimate nominal annual yields of 5.0, 5.8, and 6.5 percent, respectively.
Table 8�Present Value of Estimated HI Income Less Expenditures under Various Real-Interest Assumptions |
|||
Ultimate real-interest rate |
2.2 percent |
3.0 percent |
3.7 percent |
Income minus expenditures (in billions) |
-$12,075 |
-$8,829 |
-$6,544 |
As illustrated in Table 8, for every increase of 0.1 percentage point in the ultimate real-interest rate, the deficit decreases by approximately $370 billion.
Charts 12 and 12A show projections of the net cashflow under the three alternative real-interest assumptions presented in table 8.
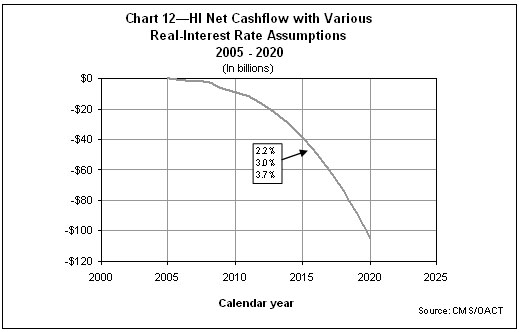

As shown in Charts 12 and 12A, the present values of the net cashflow are more sensitive to the interest assumption than is the nominal net cashflow. This is not an indication of the actual role that interest plays in HI financing. In actuality, interest finances very little of the cost of the HI trust fund because, under the intermediate assumptions, the fund is projected to be relatively low and exhausted by 2020. These results illustrate the substantial sensitivity of present value measures to different interest rate assumptions. With higher assumed interest, the very large deficits in the more distant future are discounted more heavily (that is, are given less weight), resulting in a smaller overall net present value.
HI
Under the Medicare Trustees’ intermediate assumptions, the HI trust fund is projected to be exhausted in 2020, 1 year later than in last year’s report, due primarily to slightly higher income and slightly lower costs in 2004 than previously estimated. Despite the slight improvement, income from all sources is projected to continue to exceed expenditures for only the next 7 years and to fall short by steadily increasing amounts in 2012 and later. These shortfalls can be met with increasing reliance on interest payments on invested assets and the redemption of those assets, thereby adding to the draw on the Federal budget. In the absence of corrective legislation, a depleted trust fund would initially produce payment delays, but very quickly lead to a curtailment of health care services to beneficiaries.
The HI trust fund is substantially out of financial balance in the long range. Bringing the fund into actuarial balance over the next 75 years under the intermediate assumptions would require very substantial increases in revenues and/or reductions in benefits. These changes are needed in part as a result of the impending retirement of the baby boom generation.
SMI
Under current law, the SMI trust fund will remain adequate, both in the near term and into the indefinite future, because of the automatic financing established for Parts B and D. Because there is no authority to transfer assets between the new Part D account and the existing Part B account, it is necessary to evaluate each account’s financial adequacy separately.
The financing established for the Part B account for calendar year 2005 is estimated to be sufficient to cover expenditures for that year but not to increase assets to a more adequate contingency reserve. The Part B premium and corresponding general revenue transfers will need to be increased sharply for 2006 to match projected costs and to restore Part B assets to a more adequate reserve level.
The operations of the Part D account in 2005 relate only to the transitional assistance benefit for low-income beneficiaries. No financial imbalance is anticipated, since the general revenue subsidy for this benefit is expected to be drawn on a daily, as-needed basis. Potential variations in Part D costs in 2006 and later are expected to be handled through a flexible general revenue appropriations process, eliminating the need for a significant Part D contingency reserve.
For both the Part B and Part D accounts, beneficiary premiums and general revenue transfers will be set to meet expected costs each year. However, a critical issue for the trust fund is the impact of the past and expected rapid growth of SMI costs, which place steadily increasing demands on beneficiaries, the Federal budget, and society at large.
Medicare Overall
The projections shown in this section continue to demonstrate the need for the Administration and the Congress to address the financial challenges facing Medicare�both the long-range financial imbalance facing the HI trust fund and the heightened problem of rapid growth in expenditures. In its 2005 annual report to Congress, the Medicare Boards of Trustees emphasized the seriousness of these concerns and urged the Nation’s policy makers to take “prompt, effective, and decisive action . . . to address these challenges.” It also stated: “Consideration of such reforms should occur in the relatively near future
|
U.S. Department of Health and Human Services |
||||||
|---|---|---|---|---|---|---|
CMS |
Other |
|||||
Medicare HI |
Medicare SMI |
Medicaid |
Agency |
Agency |
||
Budgetary Resources: |
||||||
1. Budget Authority |
$ 197,429 |
$153,540 |
$ 178,744 |
$ 243,417 |
$ 773,130 |
|
2. Unobligated Balances - Beginning of Period |
- |
- |
5,911 |
13,241 |
19,152 |
|
3. Spending Authority from Offsetting Collections |
1 |
- |
315 |
10,827 |
11,143 |
|
4. Recoveries of prior year obligations |
16 |
26 |
9,642 |
1,988 |
11,672 |
|
5. Temporarily not available pursuant to Public Law |
(11,175) |
25 |
- |
(320) |
(11,470) |
|
6. Permanently not available (-) |
- |
- |
(2,600) |
(7,185) |
(9,785) |
|
7. Total Budgetary Resources |
$ 186,271 |
$ 153,591 |
$ 192,012 |
$ 261,968 |
$ 793,842 |
|
Status of Budgetary Resources: |
||||||
8. Obligations Incurred |
$ 186,271 |
$ 153,591 |
$ 191,695 |
$ 244,078 |
$ 775,635 |
|
9. Unobligated Balances - Available |
- |
- |
- |
12,362 |
12,362 |
|
10. Unobligated Balances - Not Available |
- |
- |
317 |
5,528 |
5,845 |
|
11. Total Status of Budgetary Resources |
$ 186,271 |
$ 153,591 |
$ 192,012 |
$ 261,968 |
$ 793,842 |
|
Relationship of Obligations to Outlays: |
||||||
12. Obligated Balance, Net - Beginning of Period |
$ 16,090 |
$ 15,979 |
$ 9,315 |
$ 72,184 |
$ 113,568 |
|
13. Obligated Balance Transferred, Net (+/-) |
- |
- |
- |
- |
- |
|
14. Obligated Balance, Net - End of Period |
17,733 |
17,580 |
10,635 |
72,120 |
118,068 |
|
15. Outlays |
184,611 |
151,964 |
180,418 |
231,327 |
748,320 |
|
16. Less: Offsetting receipts |
13,597 |
152,133 |
- |
1,296 |
167,026 |
|
17. Net Outlays |
$ 171,014 |
$ (169) |
$ 180,418 |
$ 230,031 |
$ 581,294 |
|
Summary of Other Agency Budgetary Accounts |
||||||
Budgetary Resources |
Status of Budgetary Resources |
Net |
||||
ACF |
$ 58,373 |
$ 58,373 |
$ 45,239 |
|||
AoA |
1,400 |
1,400 |
1,386 |
|||
AHRQ |
361 |
361 |
16 |
|||
CDC |
7,138 |
7,138 |
5,895 |
|||
CMS |
138,643 |
138,643 |
133,032 |
|||
FDA |
2,112 |
2,112 |
1,316 |
|||
HRSA |
7,533 |
7,533 |
6,849 |
|||
IHS |
5,431 |
5,431 |
3,050 |
|||
NIH |
31,723 |
31,723 |
27,112 |
|||
OS |
4,656 |
4,656 |
2,653 |
|||
PSC |
948 |
948 |
304 |
|||
SAMHSA |
3,650 |
3,650 |
3,179 |
|||
$ 261,968 |
$ 261,968 |
$ 230,031 |
||||
U.S. Department of Health and Human Services
Condensed Balance Sheet
Franchise and Intra-Governmental Support Revolving Funds As of September 30, 2005 (In Millions)
HHS Service and Supply Fund |
NIH Service and Supply Fund |
Combined Totals |
|
|---|---|---|---|
Assets |
|||
Fund Balance with Treasury |
$ 71 |
$ 371 |
$ 442 |
Accounts Receivable, Net |
154 |
3 |
157 |
Property, Plant and Equip, Net |
14 |
159 |
173 |
Other Assets |
10 |
10 |
20 |
Total Assets |
$ 249 |
$ 543 |
$ 792 |
Liabilities |
|||
Accounts Payable |
$ 82 |
$ 96 |
$ 178 |
Other Liabilities |
16 |
304 |
320 |
Total Liabilities |
$ 98 |
$ 400 |
$ 498 |
Net Position |
|||
Cumulative Results of Operations |
$ 151 |
$ 143 |
$ 294 |
|
Total Liabilities and Net Position |
$ 249 |
$ 543 |
$ 792 |
U.S. Department of Health and Human Services
Condensed Statement of Net Cost
Franchise and Intra-Governmental Support Revolving Funds
For the Year Ended September 30, 2005
(In Millions)
Program/Business Line |
Gross Costs |
Less: Earned Revenue |
Net Costs |
|---|---|---|---|
HHS Service and Supply Fund |
|||
Administrative Operations Services |
$ 100 |
$ (106) |
$ (6) |
Financial Management Service |
47 |
(54) |
(7) |
Human Resources Service |
54 |
(50) |
4 |
Federal Occupational Health |
192 |
(185) |
7 |
Strategic Acquisitions Services |
79 |
(58) |
21 |
Human Resource Centers |
46 |
(49) |
(3) |
Total |
$ 518 |
$ (502) |
$ 16 |
NIH Service and Supply Fund |
|||
Research Support |
$ 938 |
$ (921) |
$ 17 |
Total |
$ 938 |
$ (921) |
$ 17 |
The Program Support Center (PSC), a component of the Office of the Secretary, manages the HHS Service and Supply Fund. The PSC provides support services to federal agencies on a competitive, “service-for-fee” basis. Services and products are available in the areas of Acquisitions, Finance, Medical Supply Operation, Health Services, Personnel and Payroll and Support Services. Major customers are other HHS Operating Divisions and components of many federal agencies including Departments of Defense, Education, Housing and Urban Development, Interior, Energy, Labor, State, Transportation, Treasury and other independent federal organizations.
The NIH Research Support provides administrative services, which include facilities management, supply stores, printing and reproduction, medical arts and photography, procurement, and a wide range of other research support services. The Information Technology (IT) reported under Research Support includes the regional data processing center, which sells computing services and programming services and enterprise IT software development. Instrumentation Services reported under Research Support include biomedical fabrication and instrumentation activities which entails creating highly technical bioengineering structures. The Animal Services reported under Research Support entails purchasing, housing and feeding animals used in research. Major customers of NIH are the Research Institutes and Centers and for computer services, the Department of Defense.
U.S. Department of Health and Human Services
Deferred Maintenance
For the Years Ended September 30, 2005 and 2004
Deferred maintenance is maintenance that was not performed when it should have been, was scheduled and not performed, or was delayed for a future period. Maintenance is the act of keeping fixed assets in acceptable condition, including preventive maintenance, normal repairs, replacement of parts and structural components and other activities needed to preserve the asset so that it continues to provide acceptable services and achieves its expected life. Maintenance does not include activities aimed at expanding the capacity of an asset or otherwise upgrading it to serve needs different from, or significantly greater than, those originally intended. Maintenance expense is recognized as incurred. The Centers for Disease Control and Prevention, the National Institutes of Health, and the Food and Drug Administration all use the condition assessment survey for all classes of property. The Indian Health Service uses two types of surveys to assess installations - annual general inspections and deep look surveys.
Category of Asset |
Condition |
Cost to Return to Acceptable Condition |
|
|---|---|---|---|
2005 |
2004 |
||
General PP&E |
|||
Buildings |
2 - 4 |
$ 961 |
$ 915 |
Equipment |
2 - 4 |
8 |
8 |
Other Structures |
2 - 4 |
25 |
37 |
Total |
$ 994 |
$ 960 |
|
Asset Condition is assessed on a scale of 1-5 as follows: Excellent-1; Good-2; Fair-3; Poor-4; Very Poor-5. A “fair” or 3 rating is considered acceptable operating condition. Although PP&E categories may be rated as acceptable, individual assets within a category may require maintenance work to return them to acceptable operating condition. Therefore, asset categories with an overall rating of “fair” or above may still report necessary costs to return them to acceptable condition.
|
U.S. Department of Health and Human Services | |||||
|---|---|---|---|---|---|
Agency |
TFM Dept Code |
Fund Bal. w/ Treasury |
Investments |
Accounts Receivable |
Other |
Dept of Agriculture |
12 |
3 |
- |
||
Dept of Commerce |
13 |
10 |
15 |
||
Dept of Defense |
17,215,797 |
39 |
- |
||
Dept of Education |
91 |
3 |
- |
||
Dept of Energy |
89 |
4 |
- |
||
Dept of the Interior |
14 |
1 |
- |
||
Dept of Justice |
15 |
5 |
- |
||
Dept of Labor |
16 |
1 |
- |
||
Dept of State |
19 |
2 |
- |
||
Dept of Transportation |
69 |
1 |
- |
||
Dept of the Treasury |
20 |
99,638 |
300,664 |
3 |
14,273 |
Dept of Veterans Affairs |
36 |
159 |
153 |
||
Agency for International Development |
72 |
5 |
- |
||
Environmental Protection Agency |
68 |
27 |
- |
||
Dept of Homeland Security |
70 |
9 |
- |
||
General Services Admin |
47 |
2 |
- |
||
National Aeronautics & Space Admin |
80 |
2 |
- |
||
National Science Foundation |
49 |
1 |
- |
||
Social Security Admin |
28 |
1 |
- |
||
RRB |
60 |
454 |
- |
||
All other Federal agencies |
- |
- |
6 |
- |
|
Total |
$ 99,638 |
$ 300,664 |
$ 738 |
$ 14,441 |
|
|
U.S. Department of Health and Human Services |
||||
|---|---|---|---|---|
Agency |
TFM Dept Code |
Accounts Payable |
Accrued Payroll & Benefits |
Other |
Dept of Commerce |
13 |
2 |
- |
- |
Dept of Defense |
17,215,797 |
12 |
- |
87 |
Dept of Housing & Urban Development |
86 |
- |
- |
2 |
Dept of Justice |
15 |
- |
- |
7 |
Dept of Labor |
16 |
- |
24 |
- |
Dept of the Treasury |
20 |
- |
9 |
485 |
Dept of Veterans Affairs |
36 |
- |
- |
4 |
Environmental Protection Agency |
68 |
- |
- |
148 |
Dept of Homeland Security |
70 |
1 |
- |
- |
General Services Admin |
47 |
52 |
- |
91 |
Office of Personnel Mgmt |
24 |
- |
36 |
- |
Social Security Admin |
28 |
296 |
- |
- |
All other Federal agencies |
2 |
- |
168 |
|
Total |
$ 365 |
$ 69 |
$ 992 |
|
|
U.S. Department of Health and Human Services |
|||||
|---|---|---|---|---|---|
Non-exchange Revenue |
|||||
Agency |
TFM Dept Code |
Earned Revenue |
Gross Cost |
Transfers-In |
Transfers-Out |
Dept of Agriculture |
12 |
9 |
(11) |
- |
- |
Dept of Commerce |
13 |
16 |
(104) |
- |
- |
Dept of Defense |
17,215,797 |
305 |
(239) |
- |
- |
Dept of Education |
91 |
14 |
(145) |
- |
- |
Dept of Energy |
89 |
29 |
(72) |
- |
- |
Dept of Housing & Urban Development |
86 |
8 |
- |
- |
- |
Dept of the Interior |
14 |
4 |
(170) |
- |
- |
Dept of Justice |
15 |
28 |
(137) |
- |
- |
Dept of Labor |
16 |
59 |
(29) |
- |
- |
Dept of State |
19 |
4 |
(86) |
- |
- |
Dept of Transportation |
69 |
2 |
(2) |
- |
- |
Dept of the Treasury |
20 |
102 |
(361) |
420 |
(62) |
Dept of Veterans Affairs |
36 |
184 |
(166) |
- |
- |
Agency for International Development |
72 |
25 |
(7) |
- |
- |
Environmental Protection Agency |
68 |
23 |
(6) |
- |
- |
Dept of Homeland Security |
70 |
172 |
(17) |
- |
- |
General Services Admin |
47 |
6 |
(707) |
- |
- |
National Aeronautics & Space Admin |
80 |
5 |
- |
- |
- |
National Science Foundation |
49 |
2 |
(17) |
- |
- |
Nuclear Regulatory Commission |
31 |
1 |
- |
- |
- |
Office of Personnel Mgmt |
24 |
- |
(1,097) |
- |
- |
Small Business Admin |
73 |
6 |
(1) |
- |
- |
Social Security Admin |
28 |
13 |
(53) |
3 |
(1,239) |
RRB |
60 |
- |
- |
477 |
(7) |
All other Federal agencies |
68 |
(108) |
- |
(10) |
|
Total |
$ 1,085 |
$ (3,535) |
$ 900 |
$ (1,318) |
|
|
U.S. Department of Health and Human Services |
|||||||||
|---|---|---|---|---|---|---|---|---|---|
Education, Training & Social Services |
Health |
Medicare |
Income Security |
Admin. of Justice |
Natural Resources & Environment |
Agency |
Intra-HHS Eliminations |
HHS Consolidated Totals |
|
Assets (Note 2) |
|||||||||
Intragovernmental |
|||||||||
Fund Balance with Treasury (Note 3) |
$ 6,478 |
$ 68,763 |
$ 1,669 |
$ 22,713 |
$ - |
$ 15 |
$ 99,638 |
$ - |
$ 99,638 |
Investments, Net (Note 5) |
- |
2,220 |
298,444 |
- |
- |
- |
300,664 |
- |
300,664 |
Accounts Receivable, Net (Note 6) |
14 |
689 |
42,150 |
1 |
- |
- |
42,854 |
(42,116) |
738 |
Anticipated Congressional Appropriation (Note 7) |
- |
9,099 |
5,173 |
- |
- |
- |
14,272 |
- |
14,272 |
Other (Note 11) |
1 |
538 |
- |
- |
- |
- |
539 |
(370) |
169 |
Total Intragovernmental |
$ 6,493 |
$ 81,309 |
$ 347,436 |
$ 22,714 |
$ - |
$ 15 |
$ 457,967 |
$ (42,486) |
$ 415,481 |
Accounts Receivable, Net (Note 6) |
- |
289 |
1,814 |
- |
- |
- |
2,103 |
- |
2,103 |
Loans Receivable and Foreclosed Property (Note 8) |
- |
379 |
- |
- |
- |
- |
379 |
- |
379 |
Cash and Other Monetary Assets (Note 4) |
- |
- |
204 |
- |
- |
- |
204 |
- |
204 |
Inventory and Related Property, Net (Note 9) |
- |
1,614 |
- |
- |
- |
- |
1,614 |
- |
1,614 |
General Property, Plant & Equipment, Net (Note 10) |
4 |
4,187 |
366 |
- |
- |
- |
4,557 |
- |
4,557 |
Other (Note 11) |
- |
(17) |
4,166 |
- |
- |
- |
4,149 |
- |
4,149 |
Total Assets |
$ 6,497 |
$ 87,761 |
$ 353,986 |
$ 22,714 |
$ - |
$ 15 |
$ 470,973 |
$ (42,486) |
$ 428,487 |
Liabilities (Note 12) |
|||||||||
Intragovernmental |
|||||||||
Accounts Payable |
$ 11 |
$ 200 |
$ 42,178 |
$ 4 |
$ - |
$ - |
$ 42,393 |
$ (42,028) |
$ 365 |
Accrued Payroll and Benefits |
1 |
64 |
4 |
- |
- |
- |
69 |
- |
69 |
Other (Note 16) |
- |
1,042 |
408 |
- |
- |
- |
1,450 |
(458) |
992 |
Total Intragovernmental |
$ 12 |
$ 1,306 |
$ 42,590 |
$ 4 |
$ - |
$ - |
$ 43,912 |
$ (42,486) |
$ 1,426 |
Accounts Payable |
17 |
703 |
- |
12 |
- |
- |
732 |
- |
732 |
Entitlement Benefits Due and Payable (Note 13) |
- |
20,355 |
33,399 |
- |
- |
- |
53,754 |
- |
53,754 |
Accrued Grant Liability (Note 15) |
750 |
2,254 |
- |
777 |
- |
2 |
3,783 |
- |
3,783 |
Loan Guarantees Liability (Note 8) |
- |
158 |
- |
- |
- |
- |
158 |
- |
158 |
Federal Employee and Veterans Benefits (Note 14) |
4 |
7,170 |
9 |
- |
- |
- |
7,183 |
- |
7,183 |
Accrued Payroll and Benefits |
16 |
718 |
49 |
2 |
- |
- |
785 |
- |
785 |
Other (Note 16) |
- |
1,207 |
1,919 |
13 |
- |
(1) |
3,138 |
- |
3,138 |
Total Liabilities |
$ 799 |
$ 33,871 |
$ 77,966 |
$ 808 |
$ - |
$ 1 |
$ 113,445 |
$ (42,486) |
$ 70,959 |
Net Position | |||||||||
Unexpended Appropriations |
5,710 |
52,858 |
6,873 |
21,909 |
- |
- |
87,350 |
- |
87,350 |
Cumulative Results of Operations |
(12) |
1,032 |
269,147 |
(3) |
- |
14 |
270,178 |
- |
270,178 |
Total Net Position |
$ 5,698 |
$ 53,890 |
$ 276,020 |
$ 21,906 |
$ - |
$ 14 |
$ 357,528 |
$ - |
$ 357,528 |
Total Liabilities and Net Position |
$ 6,497 |
$ 87,761 |
$ 353,986 |
$ 22,714 |
$ - |
$ 15 |
$ 470,973 |
$ (42,486) |
$ 428,487 |
|
U.S. Department of Health and Human Services |
|||||||||||||||
|---|---|---|---|---|---|---|---|---|---|---|---|---|---|---|---|
ACF |
AoA |
AHRQ |
CDC |
CMS |
FDA |
HRSA |
IHS |
NIH |
OS |
PSC |
SAMHSA |
Agency Consolidated Totals |
Intra-HHS Eliminations |
HHS Consolidated Totals |
|
Assets (Note 2) |
|||||||||||||||
Intragovernmental |
|||||||||||||||
Fund Balance with Treasury (Note 3) |
$ 28,624 |
$ 567 |
$ 66 |
$ 4,859 |
$ 20,789 |
$ 779 |
$ 5,923 |
$ 1,491 |
$ 29,938 |
$ 3,821 |
$ 132 |
$ 2,649 |
$ 99,638 |
$ - |
$ 99,638 |
Investments, Net (Note 5) |
- |
- |
- |
- |
298,444 |
- |
2,202 |
- |
18 |
- |
- |
- |
300,664 |
- |
300,664 |
Accounts Receivable, Net (Note 6) |
15 |
- |
18 |
16 |
454 |
15 |
25 |
26 |
4 |
233 |
151 |
13 |
970 |
(232) |
738 |
Anticipated Congressional Appropriation (Note 7) |
- |
- |
- |
- |
14,272 |
- |
- |
- |
- |
- |
- |
- |
14,272 |
- |
14,272 |
Other (Note 11) |
1 |
- |
- |
77 |
- |
- |
1 |
2 |
- |
91 |
- |
1 |
173 |
(4) |
169 |
Total Intragovernmental |
28,640 |
567 |
84 |
4,952 |
333,959 |
794 |
8,151 |
1,519 |
29,960 |
4,145 |
283 |
2,663 |
415,717 |
(236) |
415,481 |
Accounts Receivable, Net (Note 6) |
- |
- |
- |
6 |
1,884 |
75 |
1 |
117 |
11 |
1 |
6 |
2 |
2,103 |
- |
2,103 |
Loans Receivable and Foreclosed Property (Note 8) |
- |
- |
- |
- |
- |
- |
379 |
- |
- |
- |
- |
- |
379 |
- |
379 |
Cash and Other Monetary Assets (Note 4) |
- |
- |
- |
- |
204 |
- |
- |
- |
- |
- |
- |
- |
204 |
- |
204 |
Inventory and Related Property, Net (Note 9) |
- |
- |
- |
175 |
- |
- |
- |
6 |
8 |
1,415 |
10 |
- |
1,614 |
- |
1,614 |
General Property, Plant & Equipment, Net (Note 10) |
4 |
- |
1 |
861 |
392 |
332 |
2 |
818 |
2,055 |
78 |
14 |
- |
4,557 |
- |
4,557 |
Other (Note 11) |
- |
- |
- |
1 |
4,201 |
- |
- |
- |
2 |
(55) |
- |
- |
4,149 |
- |
4,149 |
Total Assets |
$ 28,644 |
$ 567 |
$ 85 |
$ 5,995 |
$ 340,640 |
$ 1,201 |
$ 8,533 |
$ 2,460 |
$ 32,036 |
$ 5,584 |
$ 313 |
$ 2,665 |
$ 428,723 |
$ (236) |
$ 428,487 |
Liabilities (Note 12) |
|||||||||||||||
Intragovernmental |
|||||||||||||||
Accounts Payable |
$ 14 |
$ 1 |
$ 3 |
$ 1 |
$ 324 |
$ 12 |
$ 59 |
$ 17 |
$ 12 |
$ 44 |
$ 8 |
$ 14 |
$ 509 |
$ (144) |
$ 365 |
Accrued Payroll and Benefits |
1 |
- |
- |
11 |
4 |
11 |
2 |
8 |
26 |
- |
5 |
1 |
69 |
- |
69 |
Other (Note 16) |
- |
- |
40 |
87 |
433 |
75 |
79 |
148 |
100 |
- |
- |
122 |
1,084 |
(92) |
992 |
Total Intragovernmental |
$ 15 |
$ 1 |
$ 43 |
$ 99 |
$ 761 |
$ 98 |
$ 140 |
$ 173 |
$ 138 |
$ 44 |
$ 13 |
$ 137 |
$ 1,662 |
$ (236) |
$ 1,426 |
Accounts Payable |
26 |
2 |
14 |
30 |
- |
8 |
28 |
41 |
419 |
58 |
77 |
29 |
732 |
- |
732 |
Entitlement Benefits Due and Payable (Note 13) |
- |
- |
- |
- |
53,754 |
- |
- |
- |
- |
- |
- |
- |
53,754 |
- |
53,754 |
Accrued Grant Liability (Note 15) |
1,444 |
83 |
13 |
124 |
- |
(3) |
394 |
14 |
1,564 |
126 |
- |
24 |
3,783 |
- |
3,783 |
Loan Guarantees Liability (Note 8) |
- |
- |
- |
- |
- |
- |
158 |
- |
- |
- |
- |
- |
158 |
- |
158 |
Federal Employee and Veterans Benefits (Note 14) |
4 |
- |
1 |
19 |
10 |
20 |
32 |
79 |
59 |
21 |
6,918 |
20 |
7,183 |
- |
7,183 |
Accrued Payroll and Benefits |
17 |
1 |
4 |
75 |
54 |
85 |
29 |
121 |
301 |
62 |
29 |
7 |
785 |
- |
785 |
Other (Note 16) |
13 |
- |
(1) |
31 |
1,926 |
206 |
779 |
112 |
57 |
16 |
- |
(1) |
3,138 |
- |
3,138 |
Total Liabilities |
$ 1,519 |
$ 87 |
$ 74 |
$ 378 |
$ 56,505 |
$ 414 |
$ 1,560 |
$ 540 |
$ 2,538 |
$ 327 |
$ 7,037 |
$ 216 |
$ 71,195 |
$ (236) |
$ 70,959 |
Net Position |
|||||||||||||||
Unexpended Appropriations |
27,137 |
482 |
2 |
4,717 |
14,706 |
145 |
4,951 |
1,358 |
27,435 |
3,900 |
38 |
2,479 |
87,350 |
- |
87,350 |
Cumulative Results of Operations |
(12) |
(2) |
9 |
900 |
269,429 |
642 |
2,022 |
562 |
2,063 |
1,357 |
(6,762) |
(30) |
270,178 |
- |
270,178 |
Total Net Position |
$ 27,125 |
$ 480 |
$ 11 |
$ 5,617 |
$ 284,135 |
$ 787 |
$ 6,973 |
$ 1,920 |
$ 29,498 |
$ 5,257 |
$ (6,724) |
$ 2,449 |
$ 357,528 |
$ - |
$ 357,528 |
Total Liabilities and Net Position |
$ 28,644 |
$ 567 |
$ 85 |
$ 5,995 |
$ 340,640 |
$ 1,201 |
$ 8,533 |
$ 2,460 |
$ 32,036 |
$ 5,584 |
$ 313 |
$ 2,665 |
$ 428,723 |
$ (236) |
$ 428,487 |
|
U. S. Department of Health and Human Services |
||||
|---|---|---|---|---|
2005 |
||||
Agency |
Inter-Agency Eliminations |
HHS |
||
Consolidated |
Earned/Exchange |
Consolidated |
||
Responsibility Segments |
Totals |
Costs (-) |
Revenues (+) 1 |
Totals |
ACF |
$ 46,680 |
$ (12) |
$ 54 |
$ 46,722 |
AoA |
1,400 |
(4) |
4 |
1,400 |
AHRQ |
9 |
(321) |
15 |
(297) |
CDC |
5,510 |
(391) |
123 |
5,242 |
CMS |
483,402 |
(8) |
251 |
483,645 |
FDA |
1,378 |
(20) |
91 |
1,449 |
HRSA |
6,700 |
(65) |
152 |
6,787 |
IHS |
3,140 |
(34) |
51 |
3,157 |
NIH |
27,348 |
(146) |
673 |
27,875 |
OS |
2,308 |
(357) |
208 |
2,159 |
PSC |
362 |
(407) |
27 |
(18) |
SAMHSA |
3,266 |
(110) |
43 |
3,199 |
Net Cost of Operations |
$ 581,503 |
$ (1,875) |
$ 1,692 |
$ 581,320 |
2004 |
||||
Agency |
Inter-Agency Eliminations |
HHS |
||
Consolidated |
Earned/Exchange |
Consolidated |
||
Responsibility Segments |
Totals |
Costs (-) |
Revenues (+)1 |
Totals |
ACF |
$ 45,940 |
$ (5) |
$ 34 |
$ 45,969 |
AoA |
1,340 |
(7) |
3 |
1,336 |
AHRQ |
80 |
(250) |
12 |
(158) |
CDC |
5,295 |
(297) |
116 |
5,114 |
CMS |
451,457 |
(2) |
192 |
451,647 |
FDA |
1,466 |
(41) |
85 |
1,510 |
HRSA |
6,920 |
(51) |
138 |
7,007 |
IHS |
3,351 |
(32) |
43 |
3,362 |
NIH |
25,748 |
(129) |
548 |
26,167 |
OS |
2,183 |
(404) |
88 |
1,867 |
PSC |
636 |
(375) |
21 |
282 |
SAMHSA |
3,134 |
(57) |
40 |
3,117 |
Net Cost of Operations |
$ 547,550 |
$ (1,650) |
$ 1,320 |
$ 547,220 |
1Eliminations for non-exchange revenue are reported in the Statement of Changes in Net Position |
||||
|
U.S. Department of Health and Human Services |
||||||||||
|---|---|---|---|---|---|---|---|---|---|---|
Responsibility Segments: |
Education, |
Health |
Medicare |
Income |
Agency |
Intra-HHS Eliminations |
HHS |
|||
Cost (-) |
Revenue |
|||||||||
ACF |
$ 11,215 |
$ - |
$ - |
$ 35,465 |
$ 46,680 |
$ (12) |
$ 54 |
$ 46,722 |
||
AoA |
1,400 |
- |
- |
- |
1,400 |
(4) |
4 |
1,400 |
||
AHRQ |
- |
9 |
- |
- |
9 |
(321) |
15 |
(297) |
||
CDC |
- |
5,510 |
- |
- |
5,510 |
(391) |
123 |
5,242 |
||
CMS |
- |
187,689 |
295,713 |
- |
483,402 |
(8) |
251 |
483,645 |
||
FDA |
- |
1,378 |
- |
- |
1,378 |
(20) |
91 |
1,449 |
||
HRSA |
- |
6,700 |
- |
- |
6,700 |
(65) |
152 |
6,787 |
||
IHS |
- |
3,140 |
- |
- |
3,140 |
(34) |
51 |
3,157 |
||
NIH |
- |
27,348 |
- |
- |
27,348 |
(146) |
673 |
27,875 |
||
OS |
- |
2,308 |
- |
- |
2,308 |
(357) |
208 |
2,159 |
||
PSC |
- |
362 |
- |
- |
362 |
(407) |
27 |
(18) |
||
SAMHSA |
- |
3,266 |
- |
- |
3,266 |
(110) |
43 |
3,199 |
||
Net Cost of Operations |
$ 12,615 |
$ 237,710 |
$ 295,713 |
$ 35,465 |
$ 581,503 |
$ (1,875) |
$ 1,692 |
$ 581,320 |
||
|
U.S. Department of Health and Human Services |
|||||||||
|---|---|---|---|---|---|---|---|---|---|
Responsibility Segments |
Intragovernmental |
With the Public |
HHS Consolidated |
||||||
Gross Cost |
Less: Exchange Revenue |
Gross Cost |
Less: Exchange Revenue |
||||||
Combined |
Eliminations |
Consolidated |
Combined |
Eliminations |
Consolidated |
||||
ACF |
$ 187 |
$ (22) |
$ 165 |
$ 38 |
$ (64) |
$ (26) |
$ 46,531 |
$ - |
$ 46,722 |
AoA |
19 |
(4) |
15 |
4 |
(4) |
- |
1,385 |
- |
1,400 |
AHRQ |
48 |
(321) |
(273) |
318 |
(15) |
303 |
279 |
- |
(297) |
CDC |
748 |
(392) |
356 |
522 |
(124) |
398 |
5,297 |
13 |
5,242 |
CMS |
600 |
(8) |
592 |
11 |
(251) |
(240) |
521,122 |
38,309 |
483,645 |
FDA |
541 |
(20) |
521 |
24 |
(91) |
(67) |
1,207 |
346 |
1,449 |
HRSA |
392 |
(77) |
315 |
126 |
(164) |
(38) |
6,525 |
91 |
6,787 |
IHS |
431 |
(34) |
397 |
198 |
(51) |
147 |
3,633 |
726 |
3,157 |
NIH |
3,515 |
(2,207) |
1,308 |
2,299 |
(2,734) |
(435) |
26,223 |
91 |
27,875 |
OS |
907 |
(594) |
313 |
914 |
(445) |
469 |
2,319 |
4 |
2,159 |
PSC |
133 |
(417) |
(284) |
499 |
(37) |
462 |
741 |
13 |
(18) |
SAMHSA |
220 |
(110) |
110 |
155 |
(43) |
112 |
3,201 |
- |
3,199 |
Totals | $ 7,741 |
$ (4,206) |
$ 3,535 |
$ 5,108 |
$ (4,023) |
$ 1,085 |
$ 618,463 |
$ 39,593 |
$ 581,320 |
-----------------------------
1 Dollar amounts that are not adjusted for inflation or other factors are referred to as “nominal.”
2 The Part D account also receives special payments from the States, representing a portion of their forgone Medicaid expenditures attributable to the new Medicare drug benefit.
3 Delivery of benefit checks normally due January 3, 2010 is expected to occur on December 31, 2009. Consequently, the Part B premiums withheld from the checks and the associated general revenue contributions are expected to be added to the Part B account on December 31, 2009. These amounts are excluded from the premium income and general revenue income for 2010.
4 In the financial statements for CMS, Medicare income and expenditures are shown from a “trust fund perspective.” All sources of income to the trust funds are reflected, and the actuarial projections can be used to assess the financial status of each trust fund. Corresponding estimates for Medicare and other Federal social insurance programs are also shown in the annual Financial Report of the United States Government, also known as the government-wide consolidated financial statement. On a consolidated basis, the estimates are shown from a “Federal budget perspective.” In particular, certain categories of trust fund income�primarily interest payments and SMI general revenues�are excluded because they represent intragovernmental transfers, rather than revenues received from the public. Thus, the consolidated financial statement focuses not on the financial status of individual trust funds, but on the overall balance between revenues and outlays for the Federal budget. Each perspective is appropriate and useful for its intended purpose.
5 Interest income is generally about 1 percent of total SMI income.
6 Present value of estimated future income less expenditures, calculated over the 75-year projection period, plus start-of-period assets.
7 As noted in footnote 4 on page III.C.6, the actuarial deficit is calculated from a trust fund perspective, reflecting all sources of income and expenditures to or from the HI and SMI trust funds. If, instead, a budget perspective is considered, as used in theconsolidated financial statement, one would compare Medicare outlays to the public with revenues received directly from the public and state governments. On this basis, transfers to the SMI trust fund from the general fund of the Treasury would be excluded, with the result that the present value of projected SMI expenditures through 2079 would exceed the present value of projected SMI premium and state transfer revenue by $21.1 trillion. When added to the corresponding differential for HI, the present value of expenditures for the Medicare program overall is projected to exceed non-general revenue receipts by $30.0 trillion. This theoretical budget impact reflects both (i) the cost to the Federal budget of SMI general revenues provided under current law and (ii) the amount that HI revenues would have to be increased to enable HI benefits to be paid at their currently scheduled level�for which there is no provision in current law.
8 The present values of income and expenditures, from one valuation period to the next, tend to increase by the growth in average wages and benefits, respectively. The present value of income less expenditures tends to increase by the interest rate plus the addition of a new 75th year difference between income and expenditures.
9 Sensitivity analysis is not done for Parts B or D of the SMI trust fund due to the financing mechanism for each account. Any change in assumptions would have no impact on the net cashflow, since the change would affect income and expenditures equally.
10 The sensitivity of the projected HI net cash flow to variations in future mortality rates is also of interest. At this time, however, relatively little is known about the relationship between improvements in life expectancy and the associated changes in health status and per beneficiary health expenditures. As a result, it is not possible at present to prepare meaningful estimates of the HI mortality sensitivity.
11 The difference between the percentage increases in the average annual wage in covered employment and the average annual CPI.
12 Other Agency Budgetary Accounts" includes the budgetary accounts of the eleven HHS Agencies other than CMS, as well as the remaining budgetary accounts not reported by CMS under Medicare and Medicaid.