 |
 |
 |
|
 | |||||
||||
|
|
|
|
|
Q8(R1) Pharmaceutical Development (PDF version of this document)
For questions regarding this draft document contact (CDER) Moheb Nasr 301-796-1900,
Topic Reference: Q8 (R1) Draft No. 8.1 Dated: 1 November 2007
Rapporteur: Dr. John Berridge (To Step 2) e-mail: john.berridge@pfizer.com
TABLE OF CONTENTS
2. Elements of Pharmaceutical Development2.1 Target Product Profile4. GLOSSARY
1. IntroductionThis guidance is an annex to ICH Q8 Pharmaceutical Development and provides further clarification of key concepts outlined in the core guideline. In addition, this annex describes the principles of quality by design (QbD). The annex is not intended to establish new standards; however, it shows how concepts and tools (e.g., design space) outlined in the parent Q8 document could be put into practice by the applicant for all dosage forms. Where a company chooses to apply quality by design and quality risk management (ICH Q9, Quality Risk Management), linked to an appropriate pharmaceutical quality system, then opportunities arise to enhance science- and risk-based regulatory approaches (see ICH Q10, Pharmaceutical Quality Systems). 1.1. Approaches to Pharmaceutical Development In all cases, the product should be designed to meet patients’ needs and the intended product performance. Strategies for product development vary from company to company and from product to product. The approach to, and extent of, development can also vary and should be outlined in the submission. An applicant might choose either an empirical approach or a more systematic approach to product development. An illustration of the potential contrasts of these approaches is shown in Appendix 1. A more systematic approach to development (also defined as quality by design) can include, for example, incorporation of prior knowledge, results of studies using design of experiments, use of quality risk management, and use of knowledge management (see ICH Q10) throughout the lifecycle of the product. Such a systematic approach can enhance the process to achieve quality and help the regulators to better understand a company’s strategy. Product and process understanding can be updated with the knowledge gained over the product lifecycle. A greater understanding of the product and its manufacturing process can create a basis for more flexible regulatory approaches. The degree of regulatory flexibility is predicated on the level of relevant scientific knowledge provided in the registration application. It is the knowledge gained and submitted to the authorities, and not the volume of data collected, that forms the basis for science- and risk-based submissions and regulatory evaluations. Nevertheless, appropriate data demonstrating that this knowledge is based on sound scientific principles should be presented with each application. Pharmaceutical development should include, at a minimum, the following elements:
An enhanced, quality by design approach to product development would additionally include the following elements:
As a result, this more systematic approach could facilitate continual improvement and innovation throughout the product lifecycle (See ICH Q10 Pharmaceutical Quality System). 2. Elements of Pharmaceutical DevelopmentThe section that follows elaborates, by means of description and example, possible approaches to gaining a more systematic, enhanced understanding of the product and process under development. The examples given are purely illustrative and are not intended to create new regulatory requirements. 2.1 Target Product ProfileA target product profile is a prospective and dynamic summary of the quality characteristics of a drug product that ideally will be achieved to ensure that the desired quality, and hence the safety and efficacy, of a drug product is realised. The target product profile forms the basis of design for the development of the product. Considerations for the target product profile should include:
2.2 Critical Quality Attributes A critical quality attribute (CQA) is a physical, chemical, biological, or microbiological property or characteristic that should be within an appropriate limit, range, or distribution to ensure the desired product quality. CQAs are generally associated with the drug substance, excipients, intermediates, and drug product. Drug product CQAs include the properties that impart the desired quality, safety, and efficacy. CQAs of solid oral dosage forms are typically those aspects affecting product purity, potency, stability, and drug release. CQAs for other delivery systems can additionally include more product specific aspects, such as aerodynamic properties for inhaled products, sterility for parenterals, and adhesive force for transdermal patches. For drug substances or intermediates, the CQAs can additionally include those properties (e.g., particle size distribution, bulk density) that affect downstream processability. Drug product CQAs are used to guide the product and process development. Potential drug product CQAs can be identified from the target product profile and/or prior knowledge. The list of potential CQAs can be modified when the formulation and manufacturing process are selected and as product knowledge and process understanding increase. Quality risk management can be used to prioritize the list of potential CQAs for subsequent evaluation. Relevant CQAs can be identified by an iterative process of quality risk management and experimentation that assesses the extent to which their variation can have an impact on the quality of the drug product. 2.3 Linking Material Attributes and Process Parameters to CQAs – Risk AssessmentRisk assessment is a valuable science-based process used in quality risk management (see ICH Q9) that can aid in identifying which material attributes and process parameters have an effect on product CQAs. While the risk assessment is typically performed early in the pharmaceutical development, it can be helpful to repeat the risk assessment as information and greater knowledge become available. Risk assessment tools can be used to identify and rank parameters (e.g., operational, equipment, input material) with potential to have an impact on product quality based on prior knowledge and initial experimental data. For an illustrative example, see Appendix 2. The initial list of potential parameters can be quite extensive, but is likely to be narrowed as process understanding is increased. The list can be refined further through experimentation to determine the significance of individual variables and potential interactions. Once the significant parameters are identified, they can be further studied (e.g., through a combination of design of experiments, mathematical models, or studies that lead to mechanistic understanding) to achieve a higher level of process understanding. 2.4 Design SpaceThe linkage between the process inputs (input variables and process parameters) and the critical quality attributes can be described in the design space. 2.4.1 Selection of variables.The risk assessment and process development experiments described in Section 2.3 can not only lead to an understanding of the linkage and effect of process inputs on product CQAs, but also help identify the variables and their ranges within which consistent quality can be achieved. These input variables can thus be selected for inclusion in the design space. An explanation should be provided in the application to describe what variables were considered, how they affect the process and product quality, and which parameters were included or excluded in the design space. An input variable or process parameter need not be included in the design space if it has no effect on delivering CQAs when the input variable or parameter is varied over the full potential range of operation. The control of these variables would be under good manufacturing practices (GMP). However, the knowledge gained from studies should be described in the submission. 2.4.2 Defining and describing a design space in a submissionA design space can be defined in terms of ranges of input variables or parameters, or through more complex mathematical relationships. It is possible to define a design space as a time dependent function (e.g., temperature and pressure cycle of a lyophilisation cycle), or as a combination of variables such as principal components of a multivariate model. Scaling factors can also be included if the design space is intended to span multiple operational scales. Analysis of historical data can provide the basis for establishing a design space. Regardless of how a design space is developed, it is expected that operation within the design space will result in a product meeting the defined quality attributes. Examples of different potential approaches to presentation of a design space are presented in Appendix 2. 2.4.3 Unit operation design space(s)The applicant can choose to establish independent design spaces for one or more unit operations, or to establish a single design space that spans multiple operations. While a separate design space for each unit operation is often simpler to develop, a design space that spans the entire process can provide more operational flexibility. For example, in the case of a drug product that undergoes degradation in solution before lyophilisation, the design space to control the extent of degradation (e.g., concentration, time, temperature) could be expressed for each unit operation, or as a sum over all unit operations. 2.4.4 Relationship of design space to scale and equipmentWhen defining a design space, the applicant should keep in mind the type of operational flexibility desired. A design space can be developed at small scale or pilot scale. The applicant should justify the relevance of a design space developed at small or pilot scale to the proposed production scale manufacturing process and discuss the potential risks in the scale-up operation. If the applicant wishes the design space to be applicable to multiple operational scales, the design space should be described in terms of relevant scale-independent parameters. For example, if a product was determined to be shear sensitive in a mixing operation, the design space could include shear rate, rather than agitation rate. Dimensionless numbers and/or models for scaling also can be included as part of the design space description. The creation of a design space can be helpful for technology transfer or site changes. The subsequent regulatory processes will be region-specific. 2.4.5 Design space versus proven acceptable rangesA combination of proven acceptable ranges does not constitute a design space. However, proven acceptable ranges based on univariate experimentation can provide some knowledge about the process. 2.4.6 Design space and edge of failureIt can be helpful to know where edges of failure could be, or to determine potential failure modes. However, it is not an essential part of establishing a design space. 2.5 Control StrategyA control strategy is designed to consistently ensure product quality. A comprehensive pharmaceutical development approach will generate process and formulation understanding that identifies sources of variability. Critical sources of variability that can lead to product failures should be identified, appropriately understood, and managed or controlled. Understanding sources of variability and their impact on downstream processes or processing, intermediate products and finished product quality can provide flexibility for shifting of controls upstream and minimise the need for end product testing. This process understanding, in combination with quality risk management (see ICH Q9), will support the control of process parameters so that the variability of raw materials can be compensated for in an adaptable process to deliver consistent product quality. This process understanding enables an alternative manufacturing paradigm where the variability of input materials might not need to be tightly constrained. Instead it can be possible to design an adaptive process step (a step that is responsive to the input materials) to ensure consistent product quality. Enhanced understanding of product performance can justify the use of surrogate tests or support real-time release in lieu of end-product testing. For example, disintegration could serve as a surrogate for dissolution for fast-disintegrating solid forms with highly soluble drug substances. Unit dose uniformity performed in-process (e.g., using weight variation coupled with near infrared (NIR) assay) can enable real-time release and provide an increased level of quality assurance compared to the traditional end-product testing using compendial content uniformity standards. Elements of a control strategy can include, but are not limited to, the following:
A control strategy can include redundant or alternative elements, if justified. For example, one element of the control strategy could rely on end-product testing, whereas an additional or alternative element could depend on real-time release using process analytical technology (PAT). The use of these alternative elements should be described in the submission. Adoption of the principles in this guideline can support the justification of alternative approaches to the setting of specification attributes and acceptance criteria as described in Q6A and Q6B. 2.6 Product Lifecycle Management and Continual ImprovementThroughout the product lifecycle, companies have opportunities to evaluate innovative approaches to improve product quality (see ICH Q10). For example, once approved, a design space provides the applicant flexibility to optimize and adjust a process as managed under their quality system. A design space is not necessarily static in nature and should be periodically reassessed to ensure that the process is working as anticipated to deliver product quality attributes. For certain design spaces using mathematical models (e.g., chemometrics models of NIR) periodic maintenance could be essential to ensure the models’ performance (e.g., checking calibration), or to update the model based upon additional data. Expansion, reduction or redefinition of the design space could be desired upon gaining additional process information. 3. Submission of Pharmaceutical Development and Related Information in Common Technical Document (CTD) FormatPharmaceutical development information is submitted in Section P.2 of the CTD. Other information resulting from pharmaceutical development studies could be accommodated by the CTD format in a number of different ways and some specific suggestions are provided below. Certain aspects (e.g., product lifecycle management, continual improvement) of this guidance are handled under the applicant’s pharmaceutical quality system (see ICH Q10) and need not be submitted in the registration application. 3.1 Quality Risk Management and Product and Process DevelopmentQuality risk management can be used at many different stages during product and process development and manufacturing implementation. The assessments used to guide and justify development decisions can be included in the relevant sections of P.2. For example, risk analyses and functional relationships linking material attributes to product CQAs can be included in P.2.1, P.2.2, and P.2.3. Risk analyses linking the design of the manufacturing process to product quality can be included in P.2.3. 3.2 Design SpaceAs an element of the proposed manufacturing process, the design space(s) can be described in the section of the application that includes the description of the manufacturing process and process controls (P.3.3). If appropriate, additional information can be provided in the section of the application that addresses the controls of critical steps and intermediates (P.3.4). The relationship of the design space(s) to the overall control strategy can be explained in the section of the application that includes the justification of the drug product specification (P.5.6). The product and manufacturing process development sections of the application (P.2.1, P.2.2, and P.2.3) are appropriate places to summarise and describe product and process development studies that provide the basis for the design space(s). 3.3 Control StrategyThe section of the application that includes the justification of the drug product specification (P.5.6) is a good place to summarise the control strategy. The summary should be clear about the various roles played by different components of the control strategy. However, detailed information about input material controls, and process controls should still be provided in the appropriate CTD format sections (e.g., drug substance section (S), control of excipients (P.4), description of manufacturing process and process controls (P.3.3), controls of critical steps and intermediates (P.3.4)). 3.4 Drug Substance Related InformationIf drug substance CQAs have the potential to affect the CQAs or manufacturing process of the drug product, some discussion of drug substance CQAs can be appropriate in the pharmaceutical development section of the application (e.g., P.2.1). 4. GLOSSARYControl Strategy: A planned set of controls, derived from current product and process understanding, that assures process performance and product quality. The controls can include parameters and attributes related to drug substance and drug product materials and components, facility and equipment operating conditions, in-process controls, finished product specifications, and the associated methods and frequency of monitoring and control. (ICH Q10) Critical Quality Attribute (CQA): A physical, chemical, biological or microbiological property or characteristic that should be within an appropriate limit, range, or distribution to ensure the desired product quality. Critical Process Parameter: A process parameter whose variability has an impact on a critical quality attribute and therefore should be monitored or controlled to ensure the process produces the desired quality. Edge of Failure: The boundary to a variable or parameter, beyond which the relevant quality attributes or specification cannot be met. Proven Acceptable Range: A characterised range of a process parameter for which operation within this range, while keeping other parameters constant, will result in producing a material meeting relevant quality criteria. Quality by Design: A systematic approach to development that begins with predefined objectives and emphasizes product and process understanding and process control, based on sound science and quality risk management. Real-time release: The ability to evaluate and ensure the acceptable quality of in-process and/or final product based on process data, which typically include a valid combination of assessed material attributes and process controls. Appendix 1. Differing Approaches to Pharmaceutical DevelopmentNote: This table is intended only to illustrate some potential contrasts between what might be considered a minimal approach and an enhanced approach regarding different aspects of pharmaceutical development and lifecycle management. It is not intended to specifically define the approach. Current practices in the pharmaceutical industry vary and typically lie between these approaches.
|
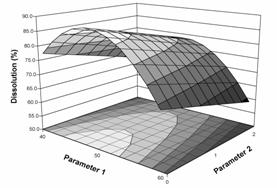

Figure 1a: Response surface plot of dissolution as a function of two parameters of a granulation operation. Dissolution above 80% is desired. |
Figure 1b: Contour plot of dissolution from example 1a. |
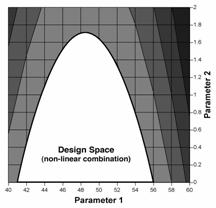
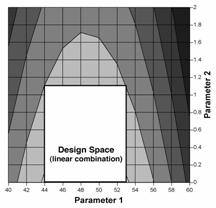
Figure 1c: Design space for granulation parameters, defined by a non-linear combination of their ranges, that delivers satisfactory dissolution (i.e., >80%). In this example, the design space can be optionally expressed by equations that describe the boundaries, i.e.,
|
Figure 1d: Design space for granulation parameters, defined by a linear combination of their ranges, that delivers satisfactory dissolution (i.e., >80%). This design space is a subset of the non-linear design space from Example 1c, and can be optionally expressed as the following:
|
Where multiple parameters are involved, the design space can be presented for two parameters, in a manner similar to the examples shown above, at different values (e.g., high, middle, low) within the range of the third parameter, the fourth parameter, and so on. A stacked plot of these design spaces can be considered, if appropriate.
Figure 2: Design space determined from the common region of successful operating ranges for multiple CQAs. The relations of two CQAs, i.e., friability and dissolution, to two process parameters of a granulation operation are shown in Figures 2a and 2b. Figure 2c shows the overlap of these regions and the maximum ranges of the potential design space.
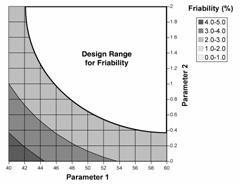
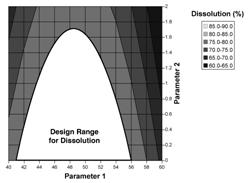
Figure 2a: Contour plot of friability as a function of Parameters 1 and 2. |
Figure 2b: Contour plot of dissolution as a function of Parameters 1 and 2. |
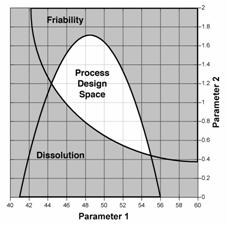
Figure 2c: Potential process design space, comprised of the overlap region of design ranges for friability and or dissolution. |
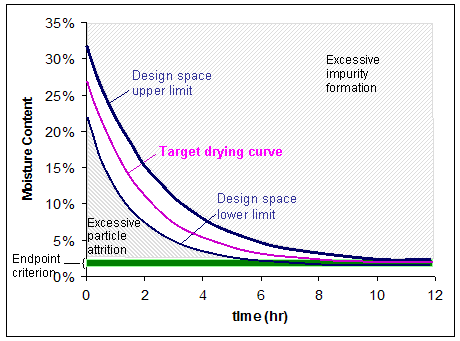
Figure 3: The design space for a drying operation that is dependent upon the path of temperature and/or pressure over time. The end point for moisture content is 1-2%. Operating above the upper limit of the design space can cause excessive impurity formation, while operating below the lower limit of the design space can result in excessive particle attrition.

![]() Back
to Top
Back
to Top ![]() Back to Guidance Page
Back to Guidance Page
![]() PDF requires the free
Adobe Acrobat Reader
PDF requires the free
Adobe Acrobat Reader
Date created: February 21, 2008