Skip
To Content
Skip
To Content
|
|
|||||||||||
| |
|
|||||||||||
|
2004 National Survey on Drug Use & Health: Results |
||||||||||||
An important limitation of estimates of drug use prevalence from the National Survey on Drug Use and Health (NSDUH) is that they are only designed to describe the target population of the survey—the civilian, noninstitutionalized population aged 12 or older. Although this population includes almost 98 percent of the total U.S. population aged 12 or older, it excludes some important and unique subpopulations who may have very different drug use patterns. For example, the survey excludes active military personnel, who have been shown to have significantly lower rates of illicit drug use. Also, persons living in institutional group quarters, such as prisons and residential drug use treatment centers, are not included in NSDUH, yet they have been shown in other surveys to have higher rates of illicit drug use. Also excluded are homeless persons not living in a shelter on the survey date; they are another population shown to have higher than average rates of illicit drug use. Appendix E describes other surveys that provide data for these populations.
The national estimates, along with the associated variance components, were computed using a multiprocedure package, SUDAAN® Software for Statistical Analysis of Correlated Data. SUDAAN was designed for the statistical analysis of data collected using stratified, multistage cluster sampling designs, as well as other observational and experimental studies involving repeated measures or studies subject to cluster correlation effects (RTI International, 2004). The final, nonresponse-adjusted, and poststratified analysis weights were used in SUDAAN to compute unbiased design-based drug use estimates.
The sampling error (i.e., the standard error [SE]) of an estimate is the error caused by the selection of a sample instead of conducting a census of the population. The sampling error may be reduced by selecting a large sample and/or by using efficient sample design and estimation strategies, such as stratification, optimal allocation, and ratio estimation.
With the use of probability sampling methods in NSDUH, it is possible to develop estimates of sampling error from the survey data. These estimates have been calculated in SUDAAN for all estimates presented in this report using a Taylor series linearization approach that takes into account the effects of the complex NSDUH design features. The sampling errors are used to identify unreliable estimates and to test for the statistical significance of differences between estimates.
Estimates of means or proportions,  d, such as drug use prevalence estimates for a domain d, can be expressed as a ratio estimate
 , D
, D
where  d is a linear statistic estimating number of substance users in the domain and
  d is a linear statistic estimating the total number of persons in domain d (both users and nonusers). The SUDAAN software used to develop estimates and their SEs produces direct estimates of d and d and their SEs. The SUDAAN application also uses a Taylor series approximation method to estimate the SEs of the ratio estimate d.
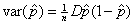
When the domain size, d , is free of sampling error, an appropriate estimate of the SE for the total number of users is
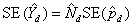 . D
. D
This approach is theoretically correct when the domain size estimates, d , are among those forced to match their respective U.S. Bureau of the Census population projections through the weight calibration process (Chen et al., 2005). In these cases, d is not subject to sampling error. For a more detailed explanation of the weight calibration process, see Section A.3.2 in Appendix A.
For estimated domain totals, d , where d is not fixed (i.e., where domain size estimates are not forced to match the U.S. Bureau of the Census population projections), this formulation may still provide a good approximation if it can be assumed that the sampling variation in d is negligible relative to the sampling variation in d . This is a reasonable assumption for most cases in this study.
For a subset of the estimates produced from the 2002, 2003, and 2004 data, the above approach yielded an underestimate of the variance of a total because d was subject to considerable variation. In these cases, the SEs for the total estimates calculated directly within SUDAAN are reported. Using the SEs from the total estimates directly from SUDAAN does not affect the SE estimates for the corresponding proportions presented in the same sets of tables.
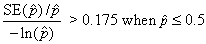
As has been done in past NSDUH reports, direct survey estimates produced for this study that are considered to be unreliable due to unacceptably large sampling errors are not shown in this report and are noted by asterisks (*) in the tables containing such estimates. The criteria used for suppressing all direct survey estimates were based on the relative standard error (RSE) (defined as the ratio of the SE over the estimate) on nominal sample size and on effective sample size.
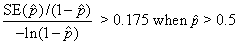
Proportion estimates within the range [0 < < 1], rates, and corresponding estimated number of users were suppressed if
RSE[-ln()]> 0.175 when  0.5
0.5
or
RSE[-ln(1 - )] > 0.175 when > 0.5. D
Using a first-order Taylor series approximation to estimate RSE[-ln[()] and RSE[-ln(1 - )] the following was obtained and used for computational purposes:
or
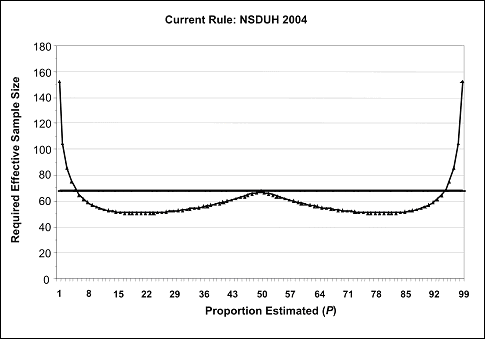
The separate formulas for 0.5 and > 0.5 produce a symmetric suppression rule (i.e., if is suppressed, then 1 - will be as well). This ad hoc rule requires an effective sample size in excess of 50. When 0.05 < < 0.95, the symmetric property of the rule produces a local maximum effective sample size of 68 at = 0.5. Thus, estimates with these values of along with effective sample sizes falling below 68 are suppressed. See Figure B.1 for a graphical representation of the required minimum effective sample sizes as a function of the proportion estimated.
A minimum nominal sample size suppression criterion (n = 100) that protects against unreliable estimates caused by small design effects and small nominal sample sizes was employed. Prevalence estimates also were suppressed if they were close to 0 or 100 percent (i.e., if < 0.00005 or if  0.99995).
Estimates of other totals (e.g., number of initiates) along with means and rates that are not bounded between 0 and 1 (e.g., mean age at first use and incidence rates) were suppressed if the RSEs of the estimates were larger than 0.5. Additionally, estimates of the mean age at first use were suppressed if the sample size was smaller than 10 respondents. Also, the estimated incidence rate and number of initiates were suppressed if they rounded to 0.
The suppression criteria for various NSDUH estimates are summarized in Table B.1 at the end of this appendix.
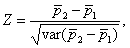
This section describes the methods used to compare prevalence estimates in this report. Customarily, the observed difference between estimates is evaluated in terms of its statistical significance. Statistical significance is based on the p value of the test statistic and refers to the probability that a difference as large as that observed would occur due to random variability in the estimates if there were no difference in the prevalence estimates for the population groups being compared. The significance of observed differences in this report is generally reported at the 0.05 and 0.01 levels. When comparing prevalence estimates, the null hypothesis (no difference between prevalence estimates) was tested against the alternative hypothesis (there is a difference in prevalence estimates) using the standard difference in proportions test expressed as
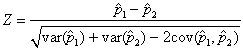 , D
, D
where 1 = first prevalence estimate, 2 = second prevalence estimate, var(1)= variance of first prevalence estimate, var(2)= variance of second prevalence estimate, and cov(1,2)= covariance between 1 and 2. In cases where significance tests between years were performed, the 2003 prevalence estimate becomes the first prevalence estimate and the 2004 estimate becomes the second prevalence estimate.
Under the null hypothesis, Z is asymptotically distributed as a normal random variable. Therefore, calculated values of Z can be referred to the unit normal distribution to determine the corresponding probability level (i.e., p value). Because the covariance term is not necessarily zero, SUDAAN was used to compute estimates of Z along with the associated p values using the analysis weights and accounting for the sample design as described in Appendix A. A similar procedure and formula for Z were used for estimated totals.
When comparing population subgroups defined by three or more levels of a categorical variable, log-linear Chi-square tests of independence of the subgroups and the prevalence variables were conducted first to control the error level for multiple comparisons. If the Chi-square test indicated overall significant differences, the significance of each particular pairwise comparison of interest was tested using SUDAAN analytic procedures to properly account for the sample design. Using the published estimates and SEs to perform independent t tests for the difference of proportions usually will provide the same results as tests performed in SUDAAN. However, where the significance level is borderline, results may differ for two reasons: (1) the covariance term is included in SUDAAN tests whereas it is not included in independent t tests, and (2) the reduced number of significant digits shown in the published estimates may cause rounding errors in the independent t tests.
As part of a comparative analysis, prevalence estimates from the Monitoring the Future (MTF) study, sponsored by the National Institute on Drug Abuse (NIDA), were presented for recency measures of selected substances (see Table 9.1). The analyses focused on the average of prevalence estimates for 8th and 10th graders and prevalence estimates for young adults aged 19 to 24, calculated by averaging estimates for persons aged 19 to 20, 21 to 22, and 23 to 24. Published results were not available from NIDA for significant differences in prevalence estimates between years for these averages. The difference between the 8th and 10th grade averages from 2002 and 2003, 2003 and 2004, and 2002 and 2004 were estimated and tested. For the difference between 2003 and 2004, for example, the estimate of the difference of the averages can be expressed as
 2-1,
2-1,
where 1=(11+12)/2, 11 and 12 are the prevalence estimates for the 8th and 10th grades, respectively, for 2003; 2 is defined similarly for 2004. The variance of some prevalence estimate can be written as
 , D
, D
where n is the sample size and D is the appropriate design effect obtained from the sampling design. In the MTF study, design effects were available for comparisons between adjacent year (i.e., 2002 vs. 2003 and 2003 vs. 2004) estimates and nonadjacent year (i.e., 2002 vs. 2004) estimates; therefore, the variance of the difference between 2 years of estimates for a particular grade can be expressed as
where i = 1 indexes the 8th grade, i = 2 indexes the 10th grade, Di is the design effect appropriate for comparisons between estimates of the 2 years, and the nji are the sample sizes corresponding to the indexed year and grade prevalence estimates, i, j = 1,2. Because the 8th and 10th grade samples were independently drawn, the variance of the difference between the 8th and 10th grade averages can be expressed as
 . D
. D
The test statistic can therefore be written as
where Z is asymptotically distributed as a standard normal random variable.
Errors can occur from nonresponse, coding errors, computer processing errors, errors in the sampling frame, reporting errors, and other errors not due to sampling. These types of errors are reduced through data editing, statistical adjustments for nonresponse, close monitoring and periodic retraining of interviewers, and improvement in various quality control procedures.
Although these types of errors often can be much larger than sampling errors, measurement of most of these errors is difficult. However, some indication of the effects of some types of these errors can be obtained through proxy measures, such as response rates and from other research studies.
In 2004, respondents continued to receive a $30 incentive in an effort to improve response rates over years prior to 2002. Of the 142,612 eligible households sampled for the 2004 NSDUH, 130,130 were successfully screened for a weighted screening response rate of 90.9 percent (Table B.2). In these screened households, a total of 81,973 sample persons were selected, and completed interviews were obtained from 67,760 of these sample persons, for a weighted interview response rate of 77.0 percent (Table B.3). A total of 9,362 (15.2 percent) sample persons were classified as refusals or parental refusals, 2,918 (3.9 percent) were not available or never at home, and 1,933 (3.9 percent) did not participate for various other reasons, such as physical or mental incompetence or language barrier (see Table B.3, which also shows the distribution of the selected sample by interview code and age group). Among demographic subgroups, the weighted interview response rate was highest among 12 to 17 year olds (88.6 percent), females (78.5 percent), blacks (81.9 percent), in nonmetropolitan areas (79.2 percent), and among persons residing in the South (78.7 percent) (Table B.4).
The overall weighted response rate, defined as the product of the weighted screening response rate and weighted interview response rate, was 70.0 percent in 2004. Nonresponse bias can be expressed as the product of the nonresponse rate (1-R) and the difference between the characteristic of interest between respondents and nonrespondents in the population (Pr - Pnr). Thus, assuming the quantity (Pr - Pnr) is fixed over time, the improvement in response rates in 2002 through 2004 over prior years will result in estimates with lower nonresponse bias.
Among survey participants, item response rates were above 99 percent for most drug use items. However, inconsistent responses for some items were common. Estimates of substance use from NSDUH are based on responses to multiple questions by respondents, so that the maximum amount of information is used in determining whether a respondent is classified as a drug user. Inconsistencies in responses are resolved through a logical editing process that involves some judgment on the part of survey analysts. Additionally, missing or inconsistent responses are imputed using statistical methodology. Editing and imputation of missing responses are potential sources of error.
Most drug use prevalence estimates, including those produced for NSDUH, are based on self-reports of use. Although studies have generally supported the validity of self-report data, it is well documented that these data often are biased (underreported or overreported) by several factors, including the mode of administration, the population under investigation, and the type of drug (Bradburn & Sudman, 1983; Hser & Anglin, 1993). Higher levels of bias also are observed among younger respondents and those with higher levels of drug use (Biglan, Gilpin, Rorhbach, & Pierce, 2004). Methodological procedures, such as biological specimens (e.g., urine, hair, saliva), proxy reports (e.g., family member, peer), and repeated measures (e.g., recanting), have been used to validate self-report data (Fendrich, Johnson, Sudman, Wislar, & Spiehler, 1999). However, these procedures often are impractical or too costly for community-based epidemiological studies (SRNT Subcommittee on Biochemical Verification, 2002). NSDUH utilizes widely accepted methodological practices for ensuring validity, such as encouraging privacy through audio computer-assisted self-interviewing (ACASI). Comparisons using these methods within NSDUH have been shown to reduce reporting bias (Aquilino, 1994; Turner, Lessler, & Gfroerer, 1992).
Several measurement issues are associated with the 2004 NSDUH that may be of interest and are discussed in this section. Specifically, these issues include the methods for measuring incidence, nicotine (cigarette) dependence, substance dependence and abuse, serious psychological distress (SPD), and depression.
For diseases, the incidence rate (IR) for a population is defined as the number of new cases of the disease, N, divided by the person time, PT, of exposure or
where the person time of exposure is defined as the length of time a person was exposed to risk. The person time of exposure can be measured for the full period of the study or for a shorter period. The person time of exposure ends at the time of diagnosis (Greenberg, Daniels, Flanders, Eley, & Boring, 1996). Similar conventions are applied for defining the incidence of first use for a particular substance. For the purposes of this study, respondents are classified as being exposed to risk as long as they reside in the United States and have the potential to initiate use of a particular substance (i.e., once a respondent has started using a substance, he or she is no longer at risk). Because incidence is calculated for respondents belonging to specific age groups, a respondent who enters or exits a particular group during the time period of interest will have a person time of exposure equal to or less than the time he or she was a member of the age group, depending on if and when substance use was initiated. Thus, respondents with a person time of exposure less than the full time period may not have been in scope during the entire period (e.g., they did not reside in the United States or were not members of the particular age group of interest), or they began initiation of the particular substance during the time period for exposure. For example, if the time period for exposure is defined as ranging from January 1, 2003, to December 31, 2003, a respondent initiating use on January 30, 2003, would have only 1 month of exposure rather than the full year.
Beginning in 1999, the survey questionnaire allows for collection of year and month of first use for recent initiates. Month, day, and year of birth also are obtained directly or are imputed for item nonrespondents as part of the data postprocessing. Additionally, the questionnaire call record provides the date of the interview. By imputing a day of first use within the year and month of first use, a specific date can be used for estimation purposes. Exposure time can be determined in terms of days and converted to years. Beginning with the 2003 NSDUH summary report, immigrants who initiated drug use outside the United States were not included in calendar year estimates of initiation. However, those immigrants who did not initiate outside the United States were included in the analysis for the time period since they entered the United States. If respondents indicated that they were not born in the United States, they were asked to provide information regarding how long they had lived in the United States. Using this information, an entry age and date were imputed.
Having specific dates of birth, first use, and entry into the United States (for immigrants) also allows the person time of exposure during the targeted period, t, to be determined. Let the target time period for measuring incidence be specified in terms of dates; for example, the period 1998 would be specified as
t = [t1,t2) = [1 Jan 1998, 1 Jan 1999),
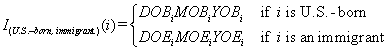
a period that includes January 1, 1998, and all days up to but not including January 1, 1999. The target age group also is defined by a half-open interval as a = [a1, a2). For example, the age group 12 to 17 would be defined by a = [12,18) for persons at least aged 12, but not yet aged 18. If person i was in age group a and residing in the United States during period t, the time and age interval referred to as the target period, Lt,a,i, is defined as follows:
Lt,a,i = {t1, t2)  {[DOBiMOBiYOBi + a1,DOBiMOBiYOBi + a2) [I{U.S.-born, immigrant}(i),
 )},
)},
and
where DOBi, MOBi, and YOBi, and DOEi, MOEi, and YOEi denote the day, month, and year of birth and entry to the United States, respectively.
Either this intersection will be empty (Lt,a,i =  ), or it will be designated by the half-open interval, Lt,a,i = [m1,i,m2i), where
m1,i = Max{t1(DOBiMOBiYOBi + a1), DOEiMOEiYOEi}
and
m2,i = Min{t2(DOBiMOBiYOBi + a2)}.
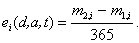
The date of first use, tfu,d,i, also is expressed as an exact date. If an incident of first drug d use by person i in age group a occurs in time tfu,d,i  [m1,i,m2,i), then the indicator function Ii(d,a,t) used to count incidents of first use is set to 1, and 0 otherwise. The person time of exposure measured in years and denoted by ei(d,a,t) for a person i of age group a depends on the date of first use. If the date of first use precedes the target period (tfu,d,i < m1,i), then ei(d,a,t) = 0. If the date of first use occurs after the target period or if person i has never used drug d, then
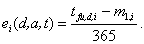
If the date of first use occurs during the target period Lt,a,i, then
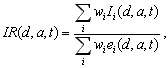
Note that both Ii(d,a,t) and ei(d,a,t) are set to 0 if the target period Lt,a,i is empty (i.e., person i is not in age group a during any part of time t). The incidence rate then is estimated as a weighted ratio estimate:
where the wi are the analytic weights. For a more detailed explanation of the incidence methodology, see Packer, Odom, Chromy, Davis, and Gfroerer (2002).
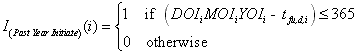
Beginning with this report, a new measure related to incidence is being calculated and is the primary focus of Chapter 5. This measure, termed "past year initiation," refers to respondents whose date of first use of a substance, tfu,d,i, was within the year prior to their interview. Past year initiation can be viewed as an indicator variable defined as follows:
where DOIi, MOIi, and YOIi denote the day, month, and year of the interview, respectively.
This measure differs from other incidence measures in that it does not refer to a particular calendar year but rather a time period equivalent to the year prior to the interview. One additional difference to be noted is that the calculation of past year initiation does not take into account whether the respondent initiated substance use while a resident of the United States. This has little effect on past year estimates and allows for direct comparability with other standard measures of substance use because the populations of interest for the measures will be the same (i.e., both measures examine all possible respondents and do not restrict to those only initiating substance use in the United States).
One important note for both the calendar year and past year estimates of incidence is the relationship between main and subcategories of substances (e.g., illicit drugs would be a main category and inhalants and marijuana would be examples of subcategories in relation to illicit drugs). Typically, any member of a subcategory is by necessity a member of the main category (e.g., if a respondent is a past month user of a particular drug, then he or she is also a past month user of illicit drugs in general). However, this is not the case with regard to incidence statistics. Because an individual can only be an initiate of a particular substance category (main or sub) a single time, a respondent with lifetime use of multiple substances may not, by necessity, be included as an initiate of a main category, even if he or she were an initiate for a particular subcategory because his or her first initiation of other substances could have occurred earlier.
Because estimates of incidence are based on retrospective reports of age at first drug use by survey respondents, they may be subject to memory-related biases, such as recall decay and telescoping. Recall decay occurs when respondents who initiated many years ago fail to report this use and will tend to result in a downward bias in estimates for earlier years (e.g., 1960s and 1970s). Telescoping occurs, for example, when an 18-year-old respondent who first used at age 12 reports his or her age at first use as 14. Telescoping such as this will tend to result in an upward bias for estimates for more recent years.
There also is likely to be some underreporting bias due to the tendency for respondents to not report socially unacceptable behavior because of respondents' fear of disclosure. This bias is likely to have the greatest impact on recent estimates, which reflect more recent use and are based heavily on reporting by young respondents for some substances, particularly alcohol, cigarettes, and inhalants. Finally, for drug use that is frequently initiated at age 10 or younger, estimates based on retrospective reports 1 year later underestimate total incidence because 11-year-old (or younger) children are not sampled by NSDUH. Prior analyses showed that alcohol and cigarette (any use) incidence estimates could be significantly affected by this.
An evaluation of NSDUH retrospective estimates of incidence suggested that these types of bias are significant and differ by substance and length of recall (Gfroerer, Hughes, Chromy, Heller, & Packer, 2004). This study showed that, for very recent time periods, such as within the past year or in the prior 2 or 3 calendar years, bias in estimates of marijuana, cocaine, alcohol, and cigarettes appears to be small, but for all other substances there is significant downward bias. Bias for all substances was shown to increase the further back in time the estimates are made, suggesting an association with the length of recall.
The past year incidence estimates are based on the data from the survey conducted that year, and they have a recall period ranging from 0 to 12 months. In other words, at the time the data are collected, the date of first drug use can be any time from today (0-month recall) to 364 days ago (12-month recall). The average length of recall for past year incidence data is 6 months. Calendar year incidence estimates have longer recall periods. For example, the recall period for 2003 calendar year incidence estimates based on the 2004 NSDUH range from 1 month (interview in January 2004, initiation in December 2003) to 23 months (interview in December 2004, initiation in January 2003), with an average recall of about 12 months. Estimates for earlier calendar years would be based on longer recall periods. This suggests that the recall bias affecting the calendar year estimates produced from one survey varies from 1 calendar year to another. For past year incidence estimates, the biases may be similar each year because the recall period is the same. Similarly, differential bias due to recall period differences could be reduced for calendar year estimates by only producing estimates for the most recent calendar year from each successive survey. For example, the 2002 calendar year estimate from the 2003 NSDUH would be expected to have a similar recall bias as the 2003 calendar year estimates from the 2004 NSDUH.
Although prior analyses and research in the literature do not provide a definitive answer to the question of which is the best approach to measure incidence with NSDUH, it is instructive to compare recent calendar year and past year incidence estimates. Exhibit B.1 shows incidence estimates based on the 2002, 2003, and 2004 NSDUHs, for four drugs. If there were no bias, and no large changes over time, it would be expected that for each drug the calendar year and past year incidence estimates would be similar (but not equal). However, for all drugs, the past year incidence estimates are lower than the corresponding calendar year incidence estimates based on each survey year. In addition, a consistent pattern is evident in the calendar year estimates, in which the highest estimate generated from each survey tends to be the calendar year 2 years before the data collection period, and estimates diminish as length of recall increases. This pattern is evident in several cases in which two or more surveys are available to produce the same calendar year estimate. For alcohol, incidence estimates for the calendar year 2 years prior to each survey average 5.4 million, while estimates with a 3-year lag average 4.6 million and those with a 4-year lag average 4.3 million. Alcohol calendar year estimates based on a 1-year lag average 4.8 million, while the past year estimates average 4.1 million. Although it is unknown which estimate is closest to the true level of incidence, clearly it is not reasonable to have a continuing annual number of new users at 5.4 million when recent single-year birth cohorts in the typical age range for alcohol initiation are only about 4 to 4.5 million. This result may be due to telescoping.
| Drug | Calendar Year Estimates (in Thousands) | |||||||||||||||
|---|---|---|---|---|---|---|---|---|---|---|---|---|---|---|---|---|
| 1999 | 2000 | 2001 | 2002 | 2003 | ||||||||||||
| Survey Year | Survey Year | Survey Year | Survey Year | Survey Year | ||||||||||||
| 2002 | 2003 | 2004 | 2002 | 2003 | 2004 | 2002 | 2003 | 2004 | 2002 | 2003 | 2004 | 2002 | 2003 | 2004 | ||
| Alcohol | 4,520 | 4,278 | 3,922 | 5,632 | 4,770 | 4,287 | 4,548 | 5,311 | 4,708 | N/A | 4,814 | 5,324 | N/A | N/A | 5,103 | |
| Cocaine | 1,083 | 877 | 852 | 1,139 | 950 | 989 | 1,160 | 1,208 | 1,093 | N/A | 1,061 | 1,100 | N/A | N/A | 1,103 | |
| Cigarettes | 3,287 | 3,372 | 3,107 | 2,963 | 3,125 | 3,254 | 2,344 | 2,724 | 2,968 | N/A | 2,429 | 2,686 | N/A | N/A | 2,620 | |
| Marijuana | 2,903 | 2,616 | 2,613 | 2,976 | 2,816 | 2,531 | 2,604 | 3,066 | 2,794 | N/A | 2,597 | 2,826 | N/A | N/A | 2,474 | |
| Drug | Past Year Estimates (in Thousands) | ||
|---|---|---|---|
| Survey Year | |||
| 2002 | 2003 | 2004 | |
| Alcohol | 3,942 | 4,082 | 4,396 |
| Cocaine | 1,032 | 9,86 | 998 |
| Cigarettes | 1,940 | 1,983 | 2,122 |
| Marijuana | 2,196 | 1,973 | 2,142 |
| N/A = not applicable. Source: SAMHSA, Office of Applied Studies, National Survey on Drug Use and Health, 2002-2004. |
|||
Although it is clear that both the calendar year and the past year incidence estimates are affected by a variety of types of bias, both can provide useful epidemiological information for researchers and policymakers. Calendar year estimates, used with caution, can be analyzed to understand historical shifts in substance use as far back as the 1960s, when marijuana use began to become widespread in the United States. To track very recent shifts and patterns in incidence, however, past year incidence estimates have several important advantages and are the primary focus of this report. The main advantages are as follows:
To improve our understanding of the validity of the estimates and to refine the methods, analyses of the bias properties of the calendar year and past year estimates of incidence are continuing.
The 2004 NSDUH computer-assisted interviewing (CAI) instrumentation included questions designed to measure nicotine dependence among current cigarette smokers. Nicotine dependence is based on criteria derived from the Nicotine Dependence Syndrome Scale (NDSS) (Shiffman, Hickcox, Gnys, Paty, & Kassel, 1995; Shiffman, Waters, & Hickcox, 2004) or the Fagerstrom Test of Nicotine Dependence (FTND) (Fagerstrom, 1978; Heatherton, Kozlowski, Frecker, & Fagerstrom, 1991). The above-mentioned criteria were first used to measure nicotine dependence in NSDUH in 2003.
The conceptual roots of the NDSS (Edwards & Gross, 1976) are similar to those behind the American Psychiatric Association (APA) Diagnostic and Statistical Manual of Mental Disorders, 4th edition (DSM-IV), concept of dependence (APA, 1994). The 2004 NSDUH contained 19 NDSS questions that addressed five aspects of dependence:
Each of the five domains listed above can be assessed by a continuous measure, but an average score across all domains also can be obtained for overall nicotine dependence (Shiffman et al., 2004). The NDSS algorithm for calculating this average score was based on the respondent's answers to 17 of the 19 questions listed above. The two items regarding nonsmoking friends (4b and 5a) were excluded due to frequently missing data.
To optimize the number of respondents who could be classified for nicotine dependence, imputation was utilized for all respondents who answered all but 1 of the 17 nicotine dependence questions that were used in the NDSS algorithm. The imputation was based on weighted least square regressions using the other 16 NDSS items as covariates in the model (Grau et al., 2005).
Responses to items 1a-c, 1e, 2a-c, 3a-c, 4a, 4c, and 5c were coded from 1 to 5 where
1 = Not at all true of me
2 = Sometimes true of me
3 = Moderately true of me
4 = Very true of me
5 = Extremely true of me
Responses to items 1d, 3d, 3e, and 5b were reverse coded from 5 to 1 where
5 = Not at all true of me
4 = Sometimes true of me
3 = Moderately true of me
2 = Very true of me
1 = Extremely true of me
The NDSS score was calculated as the sum of the responses to the previous questions divided by 17. The NDSS score was only calculated for current cigarette smokers who had complete data for all 17 questions.
A current cigarette smoker was defined as nicotine dependent if his or her NDSS score was greater than or equal to 2.75. If the NDSS score for a current cigarette smoker was less than 2.75 or the NDSS score was not defined, then the respondent was determined to be nondependent based on the NDSS. The threshold of 2.75 was derived by examining the distribution of scores in other samples of smokers administered the NDSS, including a contrast of scores obtained for nondependent smokers (chippers) versus heavy smokers (Shiffman, Paty, Kassel, Gnys, & Zettler-Segal, 1994).
The FTND is a multi-item measure of dependence, but much of its ability to discriminate dependent smokers derives from a single item that assesses how soon after waking that smokers have their first cigarette (Heatherton, Kozlowski, Frecker, Rickert, & Robinson, 1989). Because most nicotine is cleared from the bloodstream overnight, smokers typically wake in nicotine deprivation, and rapid movement to smoke is considered a sign of dependence. A current cigarette smoker was defined as nicotine dependent based on the FTND if the first cigarette smoked was within 30 minutes of waking up on the days that he or she smoked.
Using both the NDSS and the FTND measures described above, a current cigarette smoker was defined as having nicotine dependence in the past month if he or she met either the NDSS or FTND criteria for dependence.
The 2004 NSDUH CAI instrumentation included questions that were designed to measure dependence on and abuse of illicit drugs and alcohol. For these substances,1 dependence and abuse questions were based on the criteria in the DSM-IV (APA, 1994).
Specifically, for marijuana, hallucinogens, inhalants, and tranquilizers, a respondent was defined as having dependence if he or she met three or more of the following six dependence criteria:
For alcohol, cocaine, heroin, pain relievers, sedatives, and stimulants, a respondent was defined as having dependence if he or she met three or more of seven dependence criteria, including the six standard criteria listed above plus a seventh withdrawal symptom criterion. The seventh withdrawal criterion is defined by a respondent reporting having experienced a certain number of withdrawal symptoms that vary by substance (e.g., having trouble sleeping, cramps, hands tremble).
For each illicit drug and alcohol, a respondent was defined as having abused that substance if he or she met one or more of the following four abuse criteria and was determined not to be dependent on the respective substance in the past year.
Criteria used to determine whether a respondent was asked the dependence and abuse questions included responses from core substance use and frequency of substance use questions, as well as noncore substance use questions. Unknown responses in the core substance use and frequency of substance use questions were imputed. However, the imputation process did not take into account reported data in the noncore (i.e., substance dependence and abuse) CAI modules. Responses to the dependence and abuse questions that were inconsistent with the imputed substance use or frequency of substance use could have existed. Because different criteria and different combinations of criteria were used as skip logic for each substance, different types of inconsistencies may have occurred for certain substances between responses to the dependence and abuse questions and the imputed substance use and frequency of substance use as described below.
For alcohol and marijuana, respondents were asked the dependence and abuse questions if they reported substance use in the past year but did not report their frequency of substance use in the past year. Therefore, inconsistencies could have occurred where the imputed frequency of use response indicated less frequent use than required for respondents to be asked the dependence and abuse questions originally.
For cocaine, heroin, and stimulants, respondents were asked the dependence and abuse questions if they reported past year use in a core drug module or past year use in the noncore special drugs module. Thus, inconsistencies could have occurred when the response to a core substance use question indicated no use in the past year, but responses to dependence and abuse questions indicated substance dependence or abuse for the respective substance.
A respondent might have provided ambiguous information about past year use of any individual substance, in which case these respondents were not asked the dependence and abuse questions for that substance. Subsequently, these respondents could have been imputed to be past year users of the respective substance. In this situation, the dependence and abuse data were unknown; thus, these respondents were classified as not dependent on or abusing the respective substance. However, the respondent was never actually asked the dependence and abuse questions.
![]()
For this 2004 NSDUH report, serious psychological distress (SPD) was measured using the K6 screening instrument for nonspecific psychological distress (Furukawa, Kessler, Slade, & Andrews, 2003; Kessler et al., 2003a). In previous NSDUH reports, the K6 scale was used to measure serious mental illness (SMI).
SAMHSA's official definition of adults with SMI, based on a notice published in the Federal Register (SAMHSA, Center for Mental Health Services, 1993), is as follows:
Pursuant to section 1912(c) of the Public Health Service Act, adults with serious mental illness (SMI) are persons: (1) age 18 and over and (2) who currently have, or at any time during the past year, had a diagnosable mental, behavioral, or emotional disorder of sufficient duration to meet diagnostic criteria specified within DSM-IV or their ICD-9-CM equivalent (and subsequent revisions) with the exception of DSM-IV "V" codes, substance use disorders, and developmental disorders, which are excluded, unless they co-occur with another diagnosable serious mental illness. (3) That has resulted in functional impairment which substantially interferes with or limits one or more major life activities.
In NSDUH reports, the K6 scale was used to measure SMI according to the above definition. The K6 consists of six questions that ask respondents how frequently they experienced symptoms of psychological distress during the 1 month in the past year when they were at their worst emotionally. The use of this scale for SMI was based on a methodological study designed to evaluate several screening scales for measuring SMI in NSDUH. These scales consisted of a truncated version of the World Health Organization (WHO) Composite International Diagnostic Interview Short Form (CIDI-SF) scale (Kessler, Andrews, Mroczek, Üstün, & Wittchen, 1998), the K10/K6 scale of nonspecific psychological distress (Furukawa et al., 2003), and the WHO Disability Assessment Schedule (WHO-DAS) (Rehm et al., 1999).
The methodological study to evaluate the scales consisted of 155 respondents selected from a first-stage sample of 1,000 adults aged 18 or older. First-stage respondents were selected from the Boston metropolitan area and screened on the telephone to determine whether they had any emotional problems. Respondents reporting emotional problems at the first stage were oversampled when selecting the 155 respondents at the second stage. The selected respondents were interviewed by trained clinicians in respondents' homes using both the NSDUH methodology and a structured clinical interview. The first interview included the three scales described above using audio computer-assisted self-interviewing (ACASI). Respondents completed the ACASI portion of the interview without discussing their answers with the clinician. After completing the ACASI interview, respondents then were interviewed using the 12-month nonpatient version of the Structured Clinical Interview for DSM-IV (SCID; First, Spitzer, Gibbon, & Williams, 1997) and the Global Assessment of Functioning (GAF; Endicott, Spitzer, Fleiss, & Cohen, 1976) to classify respondents as either having or not having SMI. In the study, SMI was "operationally" defined as any 12-month DSM-IV disorder, other than a substance use disorder, with a GAF score of less than 60, consistent with recommendations of a SAMHSA expert panel.
The data from the 155 respondents were analyzed using logistic regression analysis to predict SMI from the scores on the screening questions. Analysis of the model fit indicated that each of the scales alone and in combination were significant predictors of SMI and the best-fitting models contained either the CIDI-SF or the K10/K6 alone. Receiver operating characteristic (ROC) curve analysis was used to evaluate the precision of the scales to discriminate between respondents with and without SMI. This analysis indicated that the K6 was the most efficient screener. The results of the methodological study and the K10/K6 scale of nonspecific psychological distress are described in more detail in Kessler et al. (2003a).
To create a score, the six items (DSNERV1, DSHOPE, DSFIDG, DSNOCHR, DSEFFORT, and DSDOWN) on the K6 scales were coded from 0 to 4 so that "all of the time" was coded 4, "most of the time" 3, "some of the time" 2, "a little of the time" 1, and "none of the time" 0, with "don't know" and "refuse" also coded 0. Summing across the transformed responses resulted in a score with a range from 0 to 24. Respondents with a total score of 13 or greater were classified as having a past year SMI. This cutpoint was chosen to equalize false positives and false negatives.
The six questions comprising the K6 scale are given as follows:
In the 2003 NSDUH, the mental health module contained a truncated version of the CIDI-SF scale, the K10/K6 scale, and the WHO-DAS scale, to mirror the questions used by Kessler et al. (2003a). Thus, the module contained a broad array of questions about mental health (i.e., panic attacks, depression, mania, phobias, generalized anxiety, posttraumatic stress disorder, and use of mental health services) that preceded the K6 items, and the four extra questions in the K10 scale were interspersed among the items in the K6 scale. In the 2004 NSDUH, the sample of respondents 18 or older was split evenly between the "long form" module, which included all items in the mental health module used in the 2003 NSDUH (sample A), and a "short form" module consisting only of the K6 items (sample B). The "short form" version was introduced to reduce interview time, removing questions that were not needed for estimation of SMI, and to provide space for a new module on depression. Inclusion of the "long form" version in half of the sample was to measure the impact on the K6 responses of changing the context of the K6.
Results from the 2004 NSDUH showed large differences between the two samples in both the K6 total score and the proportion of respondents with a K6 total score of 13 or greater. These differences were most pronounced in the 18 to 25 age group. These differences suggest that the K6 scale is not context-independent; that is, respondents appear to respond to the K6 items differently depending on whether or not the scale is preceded by a broad array of other mental health questions.
This raised concerns about the usefulness of the K6 scale in measuring SMI. There were other concerns as well. For example, the "face validity" of the K6 scale suggests that it may be more useful as a measure of psychological distress or of affective-mood and anxiety-type disorders. Another concern is that the GAF criterion in the operational definition of SMI used by Kessler et al. (2003a) might not best represent the definition in the Federal Register (SAMHSA, Center for Mental Health Services, 1993). A GAF score of less than 60 indicates moderate or worse functional impairment, which includes less severe cases than those implied by the definition in the Federal Register, which states that functional impairment should substantially interfere with or limit one or more major life activities. For this reason, SAMHSA decided to change the GAF criterion in the operational definition of SMI to reflect a GAF score of less than or equal to 50 (i.e., to indicate serious or worse functional impairment). A direct consequence of these concerns is that a decision was made that the K6 would no longer be used to measure SMI. However, the K6 data are still useful as an indicator of psychological distress. Therefore, using the same cutoff of 13, a new measure, serious psychological distress (SPD), is presented in this report. Estimates for 2002 and 2003, presented as SMI estimates, continue to be used, except that they are referred to as SPD. Given the difference in K6 reporting between the A (long form) and B (short form) samples, the 2004 SPD estimates are based only on the A sample, which used a mental health module identical to that used in 2002 and 2003. SPD potentially reflects a larger constellation of individuals than one might find using a strict application of the Federal Register definition of SMI.
Further research is under way in the Office of Applied Studies (OAS) to try to develop a valid module that will provide SMI estimates efficiently (i.e., with a small number of questions) from NSDUH. Unfortunately, given the apparent context effects and data collection differences, it may not be feasible to use results from studies that are done to develop and validate scales (including K6) for other surveys.
The 2004 NSDUH introduced two new questionnaire modules related to major depressive episodes (MDE). These questions permit estimates of the prevalence of MDE, treatment for MDE, and role impairment resulting from MDE to be calculated. Separate modules were administered to adults (aged 18 or older) and adolescents (aged 12 to 17). The adult questions were adapted from the depression section of the National Comorbidity Survey–Replication (NCS-R; Harvard School of Medicine, 2005), and the adolescent questions were adapted from the depression section of the National Comorbidity Survey–Adolescent (NCS-A; Harvard School of Medicine, 2005). Revisions to these questions were made primarily to reduce the length and to adapt the NCS questions, which are interviewer-administered, to the ACASI format used in NSDUH. In addition, some revisions, based on cognitive testing, were made to improve comprehension.
As described in Section A.1 of Appendix A, a split-sample design was implemented for adults in 2004. Adult respondents in sample A received the full module of mental health questions as administered in prior years of the survey (including the K6 scale), but did not receive the depression module (see Section B.4.4 in Appendix B). Adult respondents in sample B received the new depression module, but only the K6 questions from the previous mental health module. Separate analysis weights were constructed for each subsample.
All adolescents were administered the adolescent depression module. To make the modules developmentally appropriate, there are minor wording differences in a few questions between the adult and adolescent modules. For some estimates constructed using the depression modules, data from adults and adolescents were combined in order to analyze all persons aged 12 or older jointly. However, data on role impairment were analyzed separately because of differences in roles between adults and youths.
According to the 4th edition of the Diagnostic and Statistical Manual of Mental Disorders (DSM-IV; APA, 1994), a person is defined as having had MDE in their lifetime if he or she has had at least five or more of the following nine symptoms nearly every day in the same 2-week period, where at least one of the symptoms is a depressed mood or loss of interest or pleasure in daily activities: (1) depressed mood most of the day; (2) markedly diminished interest or pleasure in all or almost all activities most of the day; (3) significant weight loss when not sick or dieting, or weight gain when not pregnant or growing, or decrease or increase in appetite; (4) insomnia or hypersomnia; (5) psychomotor agitation or retardation; (6) fatigue or loss of energy; (7) feelings of worthlessness; (8) diminished ability to think or concentrate or indecisiveness; and (9) recurrent thoughts of death or suicidal ideation. In addition to lifetime MDE, NSDUH measures past year MDE. Respondents who have had MDE in their lifetime are asked if, during the past 12 months, they had a period of depression lasting 2 weeks or longer while also having some of the other symptoms mentioned. Those reporting past year depression are then asked questions from the Sheehan Disability Scale (SDS) to measure the severity of the past year depression.
NSDUH measures the nine attributes associated with MDE as defined in DSM-IV with the following questions. Note that the questions shown below are taken from the adult depression module. A few of the questions in the adolescent module were slightly modified to use wording more appropriate for youths. It should be noted that no exclusions were made for MDE caused by medical illness, bereavement, or substance use disorders.
The 2004 NSDUH also collects data on role impairment using the SDS, which is a measure of the impact of depression on a person's daily activities based on four domains in a person's life. Each question uses an 11-point scale, where 0 corresponds to no interference, 1-3 corresponds to mild interference, 4-5 corresponds to moderate interference, 7-9 corresponds to severe interference, and 10 corresponds to very severe interference. The overall role impairment is defined as the highest level of severity of role impairment across all four SDS role domains. Respondents were also asked to report the number of days in the past year in which they were "totally unable to work or carry out normal activities" because of depression. Estimates for role impairment are calculated separately for youths and adults because the four domains are slightly different for the two groups. The questions are listed below.
To maintain valid trend measurements, items in the NSDUH core modules on substance use are usually held constant from year to year. However, small refinements or additions to questions in the core modules are sometimes implemented to improve the questionnaire or obtain new information, when analyses indicate that the changes will have negligible impact on the estimates for which trends are needed. In the 2004 NSDUH, new questions were added pertaining to the recency, frequency, and age at initiation of nonmedical use of the prescription-type pain reliever OxyContin®.
In addition to providing prevalence and incidence statistics on OxyContin® use in 2004, responses to these new questions also were incorporated in the 2004 editing and imputation procedures used to generate aggregate estimates on the use of any prescription-type pain reliever, any prescription-type drug, and any illicit drug.
To assess the impact of the new OxyContin® questions, 2004 estimates of drug use calculated with and without responses from the OxyContin® items were compared. Comparisons also were made against 2003 estimates to assess potential effects on trends. These comparisons were made overall and within domains defined according to the demographic and geographic variables included in this report. This analysis indicated that although some 2004 statistics were slightly different when calculated with and without the new OxyContin® questions, the differences were never more than 0.1 percentage point. The trends from 2002 to 2003 in overall rates of use (i.e., pain reliever use, prescription drug use, any illicit drug use, or use of any illicit drug except marijuana) were virtually the same regardless of whether or not the new OxyContin® items were included in the calculations.
The new OxyContin® item on age at first use was used to tabulate trends in incidence of use for calendar years 1965 to 2003. It is unlikely that a person could have used prescription OxyContin® nonmedically before 1995 because OxyContin® was first approved by the Food and Drug Administration (FDA) on December 12, 1995, for prescription pain reliever use (FDA, Center for Drug Evaluation and Research, 1996) and was introduced commercially in late 1995 or early 1996. Because NSDUH data are self-reported and no restrictions are imposed on the reported date of first use, some respondents may have reported initial use prior to the date the drug became available. In using the information on trends in calendar year incidence of OxyContin® use, data indicating use before 1995 should be viewed with caution.
Similar to the NSDUH CAI instrumentation in previous years, the 2004 NSDUH CAI instrumentation included questions that were designed to measure outpatient treatment or counseling for mental health problems in the past year among adults aged 18 or older. Beginning in 2004, the CAI instrumentation also included questions that were designed to measure alternative mental health treatment or support in the past year from sources that were not listed as locations in the initial question on outpatient treatment for mental health problems. This list included nine alternative sources and one other-specify response.
In addition, a change was implemented in the assignment of "don't know" and "refused" responses for questions regarding the locations of outpatient treatment, source of payment for outpatient treatment, and reasons for not receiving treatment that was needed, which were categorized as "no" for 2003 data but were categorized as "missing" for 2004 data. As a result of this change and the questionnaire change in 2004, the 2003 data on adult outpatient treatment for mental health problems are not strictly comparable with 2004 data. However, the impact in terms of estimates is negligible, based on an analysis of the 2003 data with a recoding of the treatment data such that definitions match the 2004 data. Estimates for 2003 presented in the 2004 NSDUH report and detailed tables incorporate this recoding. Thus, estimates for outpatient treatment or counseling for mental health problems and any past year treatment or counseling for 2003 may differ from the same 2003 adult treatment or counseling estimates presented in the 2003 NSDUH detailed tables. Estimates for inpatient treatment or counseling for mental health problems and prescription medication use for mental health problems were not affected by the method changes. Estimates shown in the 2004 detailed tables for 2003 were changed by at most a few tenths of a percent from the estimates reported in the 2003 NSDUH report. Therefore, 2003 and 2004 estimates on treatment or counseling for mental health problems presented in the 2004 NSDUH detailed tables are comparable with those estimates presented in pre-2004 NSDUH reports.
| Estimate | Suppress if: |
|---|---|
| Prevalence rate, , with nominal sample size, n, and design effect, deff |
(1) The estimated prevalence rate, , is < 0.00005 or 0.99995, or (2)  D D D D(3) Effective n < 68, where Effective  or D or D(4) n < 100. Note: The rounding portion of this suppression rule for prevalence rates will produce some estimates that round at one decimal place to 0.0 or 100.0 percent but are not suppressed from the tables. |
| Estimated number (numerator of ) |
The estimated prevalence rate, , is suppressed. Note: In some instances when is not suppressed, the estimated number may appearas a 0 in the tables. This means that the estimate is greater than 0 but less than 500 (estimated numbers are shown in thousands). |
Mean age at first use, , with nominal , with nominalsample size, n |
(1) RSE() > 0.5, or (2) n < 10. |
Incidence rate,  |
(1) The incidence rate, rounds to < 0.1 per 1,000 person-years of exposure, or (2) RSE( ) > 0.5. |
Number of initiates,  |
(1) The number of initiates, rounds to < 1,000 initiates, or (2) RSE( ) > 0.5. |
| SE = standard error; RSE = relative standard error; deff = design effect. Source: SAMHSA, Office of Applied Studies, National Survey on Drug Use and Health, 2004. |
|
| Sample Size | Weighted Percentage | |||
|---|---|---|---|---|
| 2003 | 2004 | 2003 | 2004 | |
| Total Sample | 170,762 | 169,514 | 100.00 | 100.00 |
| Ineligible cases | 27,277 | 26,902 | 15.84 | 15.76 |
| Eligible cases | 143,485 | 142,612 | 84.16 | 84.24 |
| Ineligibles | 27,277 | 26,902 | 15.84 | 15.76 |
| Vacant | 14,588 | 15,204 | 52.56 | 56.24 |
| Not a primary residence | 4,377 | 4,122 | 17.07 | 15.54 |
| Not a dwelling unit | 2,349 | 2,062 | 8.08 | 7.51 |
| All military personnel | 356 | 282 | 1.39 | 1.07 |
| Other, ineligible | 5,607 | 5,232 | 20.90 | 19.65 |
| Eligible Cases | 143,485 | 142,612 | 84.16 | 84.24 |
| Screening complete | 130,605 | 130,130 | 90.72 | 90.92 |
| No one selected | 74,310 | 73,732 | 51.04 | 50.86 |
| One selected | 30,702 | 30,499 | 21.46 | 21.53 |
| Two selected | 25,593 | 25,899 | 18.22 | 18.53 |
| Screening not complete | 12,880 | 12,482 | 9.28 | 9.08 |
| No one home | 2,446 | 2,207 | 1.68 | 1.55 |
| Respondent unavailable | 280 | 259 | 0.18 | 0.18 |
| Physically or mentally incompetent | 290 | 265 | 0.18 | 0.17 |
| Language barrier—Hispanic | 42 | 51 | 0.03 | 0.04 |
| Language barrier—Other | 450 | 391 | 0.39 | 0.32 |
| Refusal | 8,414 | 8,588 | 5.98 | 6.10 |
| Other, access denied | 923 | 660 | 0.81 | 0.67 |
| Other, eligible | 12 | 10 | 0.01 | 0.01 |
| Resident < 1/2 of quarter | 0 | 0 | 0.00 | 0.00 |
| Segment not accessible | 0 | 0 | 0.00 | 0.00 |
| Screener not returned | 16 | 15 | 0.01 | 0.01 |
| Fraudulent case | 6 | 14 | 0.00 | 0.02 |
| Electronic screening problem | 1 | 22 | 0.00 | 0.02 |
| Source: SAMHSA, Office of Applied Studies, National Survey on Drug Use and Health, 2003 and 2004. | ||||
| Final Interview Code | Persons Aged 12 or Older | Persons Aged 12 to 17 | Persons Aged 18 or Older | |||||||||
|---|---|---|---|---|---|---|---|---|---|---|---|---|
| Sample Size | Weighted Percentage | Sample Size | Weighted Percentage | Sample Size | Weighted Percentage | |||||||
| 2003 | 2004 | 2003 | 2004 | 2003 | 2004 | 2003 | 2004 | 2003 | 2004 | 2003 | 2004 | |
| Total | 81,631 | 81,973 | 100.00 | 100.00 | 25,387 | 25,141 | 100.00 | 100.00 | 56,244 | 56,832 | 100.00 | 100.00 |
| Interview Complete | 67,784 | 67,760 | 77.39 | 77.00 | 22,696 | 22,309 | 89.57 | 88.56 | 45,088 | 45,451 | 75.96 | 75.66 |
| No One at Dwelling Unit |
1,242 | 1,156 | 1.60 | 1.50 | 158 | 147 | 0.62 | 0.54 | 1,084 | 1,009 | 1.71 | 1.61 |
| Respondent Unavailable |
1,809 | 1,762 | 2.44 | 2.40 | 310 | 302 | 1.25 | 1.28 | 1,499 | 1,460 | 2.58 | 2.53 |
| Break-Off | 33 | 46 | 0.09 | 0.10 | 2 | 7 | 0.01 | 0.03 | 31 | 39 | 0.10 | 0.10 |
| Physically/Mentally Incompetent |
755 | 699 | 1.82 | 1.71 | 150 | 143 | 0.60 | 0.57 | 605 | 556 | 1.96 | 1.84 |
| Language Barrier - Hispanic |
177 | 131 | 0.21 | 0.14 | 6 | 12 | 0.02 | 0.04 | 171 | 119 | 0.23 | 0.15 |
| Language Barrier - Other |
364 | 398 | 1.13 | 1.23 | 11 | 27 | 0.07 | 0.09 | 353 | 371 | 1.25 | 1.37 |
| Refusal | 7,433 | 7,871 | 14.10 | 14.52 | 486 | 583 | 1.74 | 2.17 | 6,947 | 7,288 | 15.56 | 15.96 |
| Parental Refusal | 1,476 | 1,491 | 0.61 | 0.65 | 1,476 | 1,491 | 5.81 | 6.24 | 0 | 0 | 0.00 | 0.00 |
| Other | 558 | 659 | 0.62 | 0.74 | 92 | 120 | 0.31 | 0.49 | 466 | 539 | 0.65 | 0.77 |
| Source: SAMHSA, Office of Applied Studies, National Survey on Drug Use and Health, 2003 and 2004. | ||||||||||||
| Selected Persons | Completed Interviews | Weighted Response Rate | ||||
|---|---|---|---|---|---|---|
| 2003 | 2004 | 2003 | 2004 | 2003 | 2004 | |
| Total | 81,631 | 81,973 | 67,784 | 67,760 | 77.39% | 77.00% |
| Age in Years | ||||||
| 12-17 | 25,387 | 25,141 | 22,696 | 22,309 | 89.57% | 88.56% |
| 18-25 | 27,259 | 27,408 | 22,941 | 23,075 | 83.47% | 83.87% |
| 26 or older | 28,985 | 29,424 | 22,147 | 22,376 | 74.63% | 74.22% |
| Gender | ||||||
| Male | 40,008 | 40,194 | 32,627 | 32,697 | 75.72% | 75.44% |
| Female | 41,623 | 41,779 | 35,157 | 35,063 | 78.96% | 78.46% |
| Race/Ethnicity | ||||||
| Hispanic | 10,753 | 11,020 | 8,985 | 9,218 | 79.55% | 79.06% |
| White | 55,958 | 55,544 | 46,294 | 45,557 | 77.21% | 76.71% |
| Black | 9,466 | 9,562 | 8,099 | 8,268 | 80.12% | 81.85% |
| All other races | 5,454 | 5,847 | 4,406 | 4,717 | 69.88% | 67.21% |
| Region | ||||||
| Northeast | 16,736 | 16,674 | 13,655 | 13,523 | 75.20% | 75.14% |
| Midwest | 22,665 | 22,920 | 18,993 | 18,889 | 78.56% | 77.63% |
| South | 24,725 | 24,820 | 20,612 | 20,807 | 78.38% | 78.65% |
| West | 17,505 | 17,559 | 14,524 | 14,541 | 76.51% | 75.38% |
| County Type | ||||||
| Large metropolitan | 36,610 | 37,103 | 29,759 | 30,077 | 75.49% | 75.72% |
| Small metropolitan | 27,661 | 27,404 | 23,349 | 22,972 | 79.51% | 78.12% |
| Nonmetropolitan | 17,360 | 17,466 | 14,676 | 14,711 | 79.72% | 79.23% |
| Source: SAMHSA, Office of Applied Studies, National Survey on Drug Use and Health, 2003 and 2004. | ||||||
1 Substances include alcohol, marijuana, cocaine, heroin, hallucinogens, inhalants, pain relievers, tranquilizers, stimulants, and sedatives.

This page was last updated on June 16, 2008. |
* Adobe™ PDF and MS Office™ formatted files require software viewer programs to properly read them.
Click here to download these FREE programs now
| Highlights | Topics | Data | Drugs | Pubs | Short Reports | Treatment | Help | OAS |