Coal News and Markets

Report Released: September 15, 2008
Next Release Date: September 22, 2008
The Coal News and Markets report summaries spot coal prices by coal commodity regions (i.e., Central Appalachia (CAP), Northern Appalachia (NAP), Illinois Basin (ILB), Power River Basin (PRB), Uinta Basin (UIB)) in the United States. This report includes data on: average coal spot market prices, average weekly coal commodity spot prices, monthly coal production, Eastern coal production trends, and average cost of metallurgical coal at coke plants and export docks.
| Average Weekly Coal Commodity Spot Prices (Dollars per Short Ton) |
|||||
|---|---|---|---|---|---|
| Week Ended | Central Appalachia 12,500 Btu, 1.2 SO2 |
Northern Appalachia 13,000 Btu, <3.0 SO2 |
Illinois Basin 11,800 Btu, 5.0 SO2 |
Powder River Basin 8,800 Btu, 0.8 SO2 |
Uinta Basin 11,700 Btu, 0.8 SO2 |
| 08-Aug-08 | $140.00 | $146.00 | $95.00 | $12.50 | $62.00 |
| 15-Aug-08 | $140.00 | $145.00 | $93.00 | $12.50 | $62.00 |
| 22-Aug-08 | $140.00 | $144.00 | $93.00 | $11.00 | $62.00 |
| 29-Aug-08 | $140.00 | $144.00 | $83.00 | $11.00 | $62.00 |
| 05-Sep-08 | $140.00 | $140.00 | $83.00 | $11.00 | $61.00 |
| 12-Sep-08 | $140.00 | $140.00 | $83.00 | $11.00 | $61.00 |

| U.S. Monthly Coal Production Chart data. (Million Short Tons) (through August 2008) |
 |
| Note: This graph is based on MSHA-based final data all four quarters of 2006, revised production data from MSHA for January through December 2007 and preliminary EIA production estimates for January through August 2008. |
| U.S. Eastern Coal Production Chart data. (Million Short Tons) |
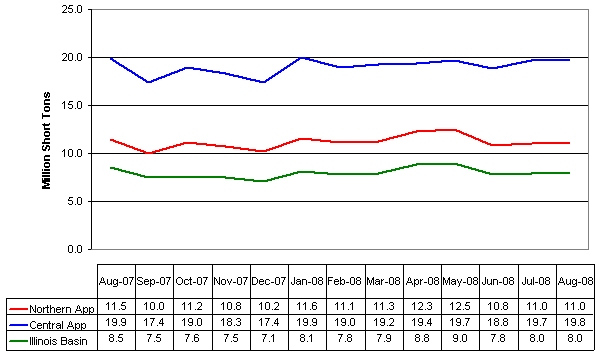 |
Note: January-March 2008 are initial estimates. January-December 2007 data are revised. All revisions are based on Mine Safety and Health Administration (MSHA) quarterly mine-level surveys. All 2006 data are final, based on MSHA’s end-of-year final survey of all quarters’ data. |
 |
| Average Cost of Metallurgical Coal Priced at Coke Plants, 1Q2005 – 1Q2008, and at Export Docks, Jan 2005 - Mar 2008 (Dollars per Short Ton)  |
Download Met Coal data files. (Excel Format) |