 |
|
|||
State Energy Profile - IdahoEnergy Information Administration - State Energy Profileshttp://tonto.eia.doe.gov/state |
||||||
|---|---|---|---|---|---|---|
|
||||||
|
Last Update: January 02, 2009
Next Update: January 08 , 2009 |
||||||
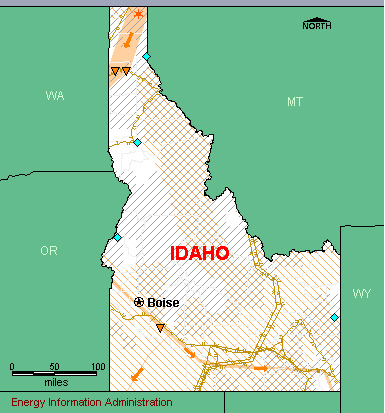
OverviewResources and ConsumptionIdaho is rich in renewable energy resources but has few fossil fuel reserves. The Snake River and several smaller river basins offer Idaho some of the greatest hydroelectric power resources in the Nation. Idaho’s geologically active mountain areas have substantial geothermal and wind power potential. The State economy is energy intensive, and energy-consuming industries include mining, forest products, and transportation equipment. Although Idaho’s total energy consumption is low when compared with other States, the total population is also low, and, as a result, per capita energy consumption is close to the national average. PetroleumIdaho markets receive petroleum product supply from refineries in Montana and Utah via two petroleum product pipelines. Total petroleum consumption is low. Idaho is one of the few States that uses conventional motor gasoline statewide. (Most States require the use of specific gasoline blends in non-attainment areas due to air-quality considerations.) Natural GasTwo natural gas pipeline systems supply Idaho. The Gas Transmission Northwest Co. pipeline system from Alberta enters the U.S. at the Kingsgate Center on Idaho’s border with Canada before flowing south to California markets. The smaller Northwest Pipeline system from Washington State supplies most of the natural gas consumed in Idaho. The industrial and residential sectors are Idaho’s largest natural gas-consuming sectors. Close to one-half of households in Idaho use natural gas as their primary energy source for home heating. Coal, Electricity, and RenewablesHydroelectric power plants dominate Idaho electricity generation, supplying nearly four-fifths of the State's production. Natural gas-fired power plants provide over one-tenth of the State’s production, while coal- and wood-fired generation and wind turbines supply the remainder. Seven of Idaho’s 10 largest generating facilities run on hydroelectric power. Idaho also has more than 30 privately owned hydroelectric power projects, including the Hells Canyon Complex on the Snake River, the largest privately owned hydroelectric power complex in the Nation. In March 2006, the Idaho State legislature passed a 2-year moratorium on licensing or processing proposals for new coal-fired power plants. Several high voltage transmission lines connect Idaho to other western power grids, enabling large interstate electricity transfers, and Idaho purchases large amounts of electricity from neighboring States to meet demand. About one-third of Idaho households use electricity as their primary energy source for home heating. |
|
| Economy | ||||
| Population and Employment | Idaho | U.S. Rank | Period | |||||||
| Population | 1.5 million | 39 |
2007 | |||||||
| Civilian Labor Force | 0.8 million | 40 |
2007 | |||||||
| Per Capita Personal Income | $31,197 | 45 |
2007 | |||||||
| Industry | Idaho | U.S. Rank | Period | |||||||
| Gross Domestic Product by State | $51.1 billion | 43 | 2007 | |||||||
| Land in Farms | 11.8 million acres | 24 |
2002 | |||||||
| Market Value of Agricultural Products Sold | $3.9 billion | 20 |
2002 | |||||||
| Prices | ||||
| Petroleum | Idaho | U.S. Avg. | Period | |||||||
| Domestic Crude Oil First Purchase | — | $98.5/barrel | Sep-08 | |||||||
| No. 2 Heating Oil, Residential | $3.583/gal | $3.666/gal | Sep-08 | |||||||
| Regular Motor Gasoline Sold Through Retail Outlets (Excluding Taxes) | $3.245/gal | $3.207/gal | Sep-08 | |||||||
| State Tax Rate on Motor Gasoline (other taxes may apply) |
$0.25/gal | $0.2159/gal | Aug-08 | |||||||
| No. 2 Diesel Fuel Sold Through Retail Outlets (Excluding Taxes) | $3.564/gal | $3.484/gal | Sep-08 | |||||||
| State Tax Rate on On-Highway Diesel (other taxes may apply) |
$0.25/gal | $0.2214/gal | Aug-08 | |||||||
| Natural Gas | Idaho | U.S. Avg. | Period | |||||||
| Wellhead | — | $6.40/thousand cu ft | 2006 | |||||||
| City Gate | $9.51/thousand cu ft | $8.96/thousand cu ft | Sep-08 | |||||||
| Residential | $11.71/thousand cu ft | $17.94/thousand cu ft | Sep-08 | |||||||
| Coal | Idaho | U.S. Avg. | Period | |||||||
| Average Open Market Sales Price | — | $26.20/short ton | 2007 | |||||||
| Delivered to Electric Power Sector | — | $ 2.16 /million Btu | Sep-08 | |||||||
| Electricity | Idaho | U.S. Avg. | Period | |||||||
| Residential | 7.30 cents/kWh | 11.94 cents/kWh | Sep-08 | |||||||
| Commercial | 5.89 cents/kWh | 10.77 cents/kWh | Sep-08 | |||||||
| Industrial | 5.03 cents/kWh | 7.36 cents/kWh | Sep-08 | |||||||
|
|||||||||||||||||||||||||
| Reserves | Idaho | Share of U.S. | Period | ||||||||||||||||||||||
| Crude Oil | — | — | 2007 | ||||||||||||||||||||||
| Dry Natural Gas | — | — | 2007 | ||||||||||||||||||||||
| Natural Gas Liquids | — | — | 2007 | ||||||||||||||||||||||
| Recoverable Coal at Producing Mines | — | — | 2007 | ||||||||||||||||||||||
| Rotary Rigs & Wells | Idaho | Share of U.S. | Period | ||||||||||||||||||||||
| Rotary Rigs in Operation | 0 | 0.0% | 2007 | ||||||||||||||||||||||
| Crude Oil Producing Wells | 0 | 0.0% | 2007 | ||||||||||||||||||||||
| Natural Gas Producing Wells | — | — | 2006 | ||||||||||||||||||||||
| Production | Idaho | Share of U.S. | Period | ||||||||||||||||||||||
| Total Energy | 113 trillion Btu | 0.2% | 2005 | ||||||||||||||||||||||
| Crude Oil | — | — | Jul-08 | ||||||||||||||||||||||
| Natural Gas - Marketed | — | — | 2006 | ||||||||||||||||||||||
| Coal | — | — | 2007 | ||||||||||||||||||||||
| Capacity | Idaho | Share of U.S. | Period | ||||||||||||||||||||||
| Crude Oil Refinery Capacity (as of Jan. 1) | — | — | 2008 | ||||||||||||||||||||||
| Electric Power Industry Net Summer Capability | 3,210 MW | 0.3% | 2006 | ||||||||||||||||||||||
| Net Electricity Generation | Idaho | Share of U.S. | Period | ||||||||||||||||||||||
| Total Net Electricity Generation | 851 thousand MWh | 0.3% | Sep-08 | ||||||||||||||||||||||
| Petroleum-Fired | 0 thousand MWh | 0.0% | Sep-08 | ||||||||||||||||||||||
| Natural Gas-Fired | 160 thousand MWh | 0.2% | Sep-08 | ||||||||||||||||||||||
| Coal-Fired | 7 thousand MWh | 0.0% | Sep-08 | ||||||||||||||||||||||
| Nuclear | — | — | Sep-08 | ||||||||||||||||||||||
| Hydroelectric | 644 thousand MWh | 3.9% | Sep-08 | ||||||||||||||||||||||
| Other Renewables | 40 thousand MWh | 0.5% | Sep-08 | ||||||||||||||||||||||
| Stocks | Idaho | Share of U.S. | Period | ||||||||||||||||||||||
| Motor Gasoline (Excludes Pipelines) | 141 thousand barrels | 0.2% | Sep-08 | ||||||||||||||||||||||
| Distillate Fuel Oil (Excludes Pipelines) | 173 thousand barrels | 0.2% | Sep-08 | ||||||||||||||||||||||
| Natural Gas in Underground Storage | — | — | Sep-08 | ||||||||||||||||||||||
| Petroleum Stocks at Electric Power Producers | W | W | Sep-08 | ||||||||||||||||||||||
| Coal Stocks at Electric Power Producers | W | W | Sep-08 | ||||||||||||||||||||||
| Production Facilities | Idaho | ||||||||||||||||||||||||
| Major Coal Mines | None | ||||||||||||||||||||||||
| Petroleum Refineries | None | ||||||||||||||||||||||||
| Major Non-Nuclear Electricity Generating Plants | Brownlee (Idaho Power Co) • Dworshak (USCE-North Pacific Division) • Cabinet Gorge (Avista Corp) • Rathdrum Power LLC (Rathdrum Operating Services Co. • Inc.) • Palisades (U S Bureau of Reclamation) | ||||||||||||||||||||||||
| Nuclear Power Plants | None | ||||||||||||||||||||||||
| Distribution & Marketing | ||||
| Distribution Centers | Idaho | |||||||||
| Oil Seaports/Oil Import Sites | None | |||||||||
| Natural Gas Market Centers | Kingsgate Center (Market Hub Services) | |||||||||
| Major Pipelines | Idaho | |||||||||
| Crude Oil | None | |||||||||
| Petroleum Product | Chevron • Yellowstone. | |||||||||
| Liquefied Petroleum Gases | None | |||||||||
| Interstate Natural Gas Pipelines | Northwest Pipeline Corp. | |||||||||
| Fueling Stations | Idaho | Share of U.S. | Period | |||||||
| Motor Gasoline | 790 | 0.5% | 2007 | |||||||
| Liquefied Petroleum Gases | 27 | 1.2% | 2007 | |||||||
| Compressed Natural Gas | 7 | 0.9% | 2007 | |||||||
| Ethanol | 5 | 0.4% | 2007 | |||||||
| Other Alternative Fuels | 5 | 0.4% | 2007 | |||||||
| Consumption | ||||
| per Capita | Idaho | U.S. Rank | Period | |||||||
| Total Energy | 352 million Btu | 22 | 2006 | |||||||
| by Source | Idaho | Share of U.S. | Period | |||||||
| Total Energy | 515 trillion Btu | 0.5% | 2006 | |||||||
| Total Petroleum | 30,692 thousand barrels | 0.4% | 2006 | |||||||
| Motor Gasoline | 15,681 thousand barrels | 0.5% | 2006 | |||||||
| Distillate Fuel | 9,970 thousand barrels | 0.7% | 2006 | |||||||
| Liquefied Petroleum Gases | 1,634 thousand barrels | 0.2% | 2006 | |||||||
| Jet Fuel | 981 thousand barrels | 0.2% | 2006 | |||||||
| Natural Gas | 75,728 million cu ft | 0.3% | 2006 | |||||||
| Coal | 403 thousand short tons | 0.0% | 2006 | |||||||
| by End-Use Sector | Idaho | Share of U.S. | Period | |||||||
| Residential | 118,017 billion Btu | 0.6% | 2006 | |||||||
| Commercial | 80,613 billion Btu | 0.5% | 2006 | |||||||
| Industrial | 184,233 billion Btu | 0.6% | 2006 | |||||||
| Transportation | 131,780 billion Btu | 0.5% | 2006 | |||||||
| for Electricity Generation | Idaho | Share of U.S. | Period | |||||||
| Petroleum | 0 thousand barrels | 0.0% | Sep-08 | |||||||
| Natural Gas | 1,140 million cu ft | 0.2% | Sep-08 | |||||||
| Coal | 2 thousand short tons | 0.0% | Sep-08 | |||||||
| for Home Heating (share of households) | Idaho | U.S. Avg. | Period | |||||||
| Natural Gas | 45% | 51.2% | 2000 | |||||||
| Fuel Oil | 5% | 9.0% | 2000 | |||||||
| Electricity | 34% | 30.3% | 2000 | |||||||
| Liquefied Petroleum Gases | 6% | 6.5% | 2000 | |||||||
| Other/None | 10% | 1.8% | 2000 | |||||||
| Environment | ||||
| Special Programs | Idaho | |||||||||
| Clean Cities Coalitions | Treasure Valley | |||||||||
| Alternative Fuels | Idaho | Share of U.S. | Period | |||||||
| Alternative-Fueled Vehicles in Use | 3,506 | 0.6% | 2006 | |||||||
| Ethanol Plants | 0 | 0.0% | 2008 | |||||||
| Ethanol Plant Capacity | 0 million gal/year | 0.0% | 2008 | |||||||
| Ethanol Use in Gasohol | 0 thousand gal | 0.0% | 2004 | |||||||
| Electric Power Industry Emissions | Idaho | Share of U.S. | Period | |||||||
| Carbon Dioxide |
875,324 metric tons | 0.0% | 2006 | |||||||
| Sulfur Dioxide |
4,540 metric tons | 0.0% | 2006 | |||||||
| Nitrogen Oxide |
1,990 metric tons | 0.1% | 2006 | |||||||
| — = No data reported; NA = Not available; W = Withheld to avoid disclosure of individual company data. |
|
||||||||||||||||||||||||||||||||||||||||||||||||||||||||||||||||||||||||||||||||||||||||||||||||||||||||||||||||||||||||||||||||||||||||||||||||||||||||||||||