|
|
|||
State Energy Profile - MontanaEnergy Information Administration - State Energy Profileshttp://tonto.eia.doe.gov/state |
||||||
|---|---|---|---|---|---|---|
|
||||||
|
Last Update: January 02, 2009
Next Update: January 08 , 2009 |
||||||
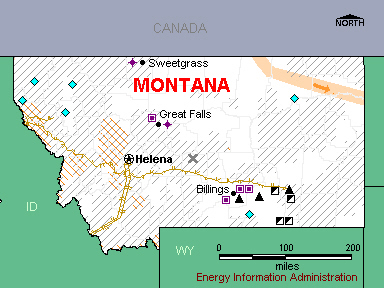
OverviewResources and ConsumptionMontana is rich in fossil fuel resources and renewable energy potential. Its geologic basins hold more than one-fourth of the Nation’s estimated recoverable coal reserves. Montana’s eastern basins also hold large deposits of oil and gas. Rivers flowing from Montana’s Rocky Mountains offer substantial hydroelectric power resources. Montana contains considerable wind energy potential throughout the State. Montana’s population and total energy demand are low. However, the State economy is energy intensive and per capita energy consumption is relatively high. The industrial sector, which includes the energy-intensive mining industry, dominates State energy consumption. PetroleumMontana typically accounts for roughly 2 percent of annual U.S. crude oil production. Production is concentrated in the Williston Basin, which covers eastern Montana and western North Dakota and contains two of the Nation’s 100 largest oil fields. Several pipelines carry Williston production south to Wyoming and east to Midwest markets. Refineries near Billings supply regional markets with petroleum products, using crude oil brought in primarily from Wyoming and Alberta, Canada. During the winter months, Montana requires oxygenated motor gasoline in the Missoula area but allows the use of conventional motor gasoline in the rest of the State. Natural GasMontana produces minor quantities of natural gas. Although production is low, demand is lower, and Montana ships nearly one-half of its natural gas output to out-of-State markets. Several natural gas pipeline systems pass through the State, transporting Canadian supplies to Midwest markets. About three-fifths of Montana households use natural gas as their primary energy source for home heating. Coal, Electricity, and RenewablesMontana typically accounts for roughly 4 percent of total annual U.S. coal production. The majority of Montana’s output is produced from several large surface mines in the Powder River Basin, which straddles the border between Montana and Wyoming. Just over one-fourth of Montana’s coal production is used for State electricity generation; Montana delivers the remainder to markets in more than 15 States. Minnesota and Michigan are the largest recipients of Montana coal. Accounting for about two-thirds of State electricity generation, coal-fired power plants dominate the Montana electricity market. Hydroelectric power accounts for most of the remainder. Montana is among the leading hydroelectric power producers in the United States, and seven of the State’s 10 largest generating plants run on hydroelectric power. The State has also initiated programs to expand and enhance hydroelectric power capacity. With several operational wind farm projects in central Montana, just east of the Rockies, the State had 146 megawatts of wind power capacity at the end of 2006. High-voltage transmission lines connect Montana to other western electric power grids, allowing Montana to export large amounts of electricity to neighboring States. |
|
| Economy | ||||
| Population and Employment | Montana | U.S. Rank | Period | |||||||
| Population | 1.0 million | 44 |
2007 | |||||||
| Civilian Labor Force | 0.5 million | 44 |
2007 | |||||||
| Per Capita Personal Income | $32,458 | 42 |
2007 | |||||||
| Industry | Montana | U.S. Rank | Period | |||||||
| Gross Domestic Product by State | $34.3 billion | 47 | 2007 | |||||||
| Land in Farms | 59.6 million acres | 2 |
2002 | |||||||
| Market Value of Agricultural Products Sold | $1.9 billion | 32 |
2002 | |||||||
| Prices | ||||
| Petroleum | Montana | U.S. Avg. | Period | |||||||
| Domestic Crude Oil First Purchase |
$92.49/barrel
|
$98.5/barrel | Sep-08 | |||||||
| No. 2 Heating Oil, Residential | — | $3.666/gal | Sep-08 | |||||||
| Regular Motor Gasoline Sold Through Retail Outlets (Excluding Taxes) | $3.255/gal | $3.207/gal | Sep-08 | |||||||
| State Tax Rate on Motor Gasoline (other taxes may apply) |
$0.27/gal | $0.2159/gal | Aug-08 | |||||||
| No. 2 Diesel Fuel Sold Through Retail Outlets (Excluding Taxes) | — | $3.484/gal | Sep-08 | |||||||
| State Tax Rate on On-Highway Diesel (other taxes may apply) |
$0.2775/gal | $0.2214/gal | Aug-08 | |||||||
| Natural Gas | Montana | U.S. Avg. | Period | |||||||
| Wellhead | $5.53/thousand cu ft | $6.40/thousand cu ft | 2006 | |||||||
| City Gate | $6.94/thousand cu ft | $8.96/thousand cu ft | Sep-08 | |||||||
| Residential | $15.30/thousand cu ft | $17.94/thousand cu ft | Sep-08 | |||||||
| Coal | Montana | U.S. Avg. | Period | |||||||
| Average Open Market Sales Price | $11.79/short ton | $26.20/short ton | 2007 | |||||||
| Delivered to Electric Power Sector | W | $ 2.16 /million Btu | Sep-08 | |||||||
| Electricity | Montana | U.S. Avg. | Period | |||||||
| Residential | 9.74 cents/kWh | 11.94 cents/kWh | Sep-08 | |||||||
| Commercial | 9.06 cents/kWh | 10.77 cents/kWh | Sep-08 | |||||||
| Industrial | 6.45 cents/kWh | 7.36 cents/kWh | Sep-08 | |||||||
|
|||||||||||||||||||||||||
| Reserves | Montana | Share of U.S. | Period | ||||||||||||||||||||||
| Crude Oil | 410 million barrels | 1.9% | 2007 | ||||||||||||||||||||||
| Dry Natural Gas | 1,052 billion cu ft | 0.4% | 2007 | ||||||||||||||||||||||
| Natural Gas Liquids | 11 million barrels | 0.1% | 2007 | ||||||||||||||||||||||
| Recoverable Coal at Producing Mines | 1,251 million short tons | 6.6 % | 2007 | ||||||||||||||||||||||
| Rotary Rigs & Wells | Montana | Share of U.S. | Period | ||||||||||||||||||||||
| Rotary Rigs in Operation | 17 | 1.0% | 2007 | ||||||||||||||||||||||
| Crude Oil Producing Wells | 4,229 | 0.8% | 2007 | ||||||||||||||||||||||
| Natural Gas Producing Wells | 6,578 | 1.5% | 2006 | ||||||||||||||||||||||
| Production | Montana | Share of U.S. | Period | ||||||||||||||||||||||
| Total Energy | 1,140 trillion Btu | 1.6% | 2005 | ||||||||||||||||||||||
| Crude Oil | 2,206 thousand barrels | 1.9% | Jul-08 | ||||||||||||||||||||||
| Natural Gas - Marketed | 112,845 million cu ft | 0.6% | 2006 | ||||||||||||||||||||||
| Coal | 43,390 thousand short tons | NA | 2007 | ||||||||||||||||||||||
| Capacity | Montana | Share of U.S. | Period | ||||||||||||||||||||||
| Crude Oil Refinery Capacity (as of Jan. 1) | 187,100 barrels/calendar day | 1.1% | 2008 | ||||||||||||||||||||||
| Electric Power Industry Net Summer Capability | 5,437 MW | 0.6% | 2006 | ||||||||||||||||||||||
| Net Electricity Generation | Montana | Share of U.S. | Period | ||||||||||||||||||||||
| Total Net Electricity Generation | 2,178 thousand MWh | 0.6% | Sep-08 | ||||||||||||||||||||||
| Petroleum-Fired | 3 thousand MWh | 0.1% | Sep-08 | ||||||||||||||||||||||
| Natural Gas-Fired | 7 thousand MWh | 0.0% | Sep-08 | ||||||||||||||||||||||
| Coal-Fired | 1,432 thousand MWh | 0.9% | Sep-08 | ||||||||||||||||||||||
| Nuclear | — | — | Sep-08 | ||||||||||||||||||||||
| Hydroelectric | 677 thousand MWh | 4.1% | Sep-08 | ||||||||||||||||||||||
| Other Renewables | 31 thousand MWh | 0.4% | Sep-08 | ||||||||||||||||||||||
| Stocks | Montana | Share of U.S. | Period | ||||||||||||||||||||||
| Motor Gasoline (Excludes Pipelines) | 856 thousand barrels | 1.5% | Sep-08 | ||||||||||||||||||||||
| Distillate Fuel Oil (Excludes Pipelines) | 676 thousand barrels | 0.7% | Sep-08 | ||||||||||||||||||||||
| Natural Gas in Underground Storage | 208,953 million cu ft | 2.8% | Sep-08 | ||||||||||||||||||||||
| Petroleum Stocks at Electric Power Producers | W | W | Sep-08 | ||||||||||||||||||||||
| Coal Stocks at Electric Power Producers | W | W | Sep-08 | ||||||||||||||||||||||
| Production Facilities | Montana | ||||||||||||||||||||||||
| Major Coal Mines | Rosebud Mine & Crusher/Conveyor/Western Energy Company • Spring Creek Coal Company/Spring Creek Coal Company • Decker Mine/Decker Coal Company • Absaloka Mine/Washington Group International | ||||||||||||||||||||||||
| Petroleum Refineries | Cenex Harvest States Coop (Laurel) • ConocoPhillipsCo (Billings) • ExxonMobil Refining & Supply Co (Billings) • Montana Refining Co (Great Falls) | ||||||||||||||||||||||||
| Major Non-Nuclear Electricity Generating Plants | Colstrip (PPL Montana LLC) • Noxon Rapids (Avista Corp) • Libby (USCE-North Pacific Division) • Hungry Horse (U S Bureau of Reclamation) • Yellowtail (U S Bureau of Reclamation) | ||||||||||||||||||||||||
| Nuclear Power Plants | None | ||||||||||||||||||||||||
| Distribution & Marketing | ||||
| Distribution Centers | Montana | |||||||||
| Oil Seaports/Oil Import Sites | Sweetgrass • Great Falls. | |||||||||
| Natural Gas Market Centers | None | |||||||||
| Major Pipelines | Montana | |||||||||
| Crude Oil | Amoco • Belle Fourche • Cenex • Conoco • Exxon • Portal • Shell • Texaco • Wascana. | |||||||||
| Petroleum Product | Cenex • Conoco • Yellowstone. | |||||||||
| Liquefied Petroleum Gases | Conoco | |||||||||
| Interstate Natural Gas Pipelines | KM Interstate Gas Co. • Northern Border Pipeline Co. • Northern Natural Gas Co. • Northwest Energy Co. Shoshone Pipeline Co. Williston Basin Piplein Co. | |||||||||
| Fueling Stations | Montana | Share of U.S. | Period | |||||||
| Motor Gasoline | 400 | 0.2% | 2007 | |||||||
| Liquefied Petroleum Gases | 31 | 1.4% | 2007 | |||||||
| Compressed Natural Gas | 3 | 0.4% | 2007 | |||||||
| Ethanol | 2 | 0.1% | 2007 | |||||||
| Other Alternative Fuels | 4 | 0.3% | 2007 | |||||||
| Consumption | ||||
| per Capita | Montana | U.S. Rank | Period | |||||||
| Total Energy | 453 million Btu | 10 | 2006 | |||||||
| by Source | Montana | Share of U.S. | Period | |||||||
| Total Energy | 429 trillion Btu | 0.4% | 2006 | |||||||
| Total Petroleum | 35,601 thousand barrels | 0.5% | 2006 | |||||||
| Motor Gasoline | 11,960 thousand barrels | 0.4% | 2006 | |||||||
| Distillate Fuel | 12,232 thousand barrels | 0.8% | 2006 | |||||||
| Liquefied Petroleum Gases | 2,500 thousand barrels | 0.3% | 2006 | |||||||
| Jet Fuel | 1,045 thousand barrels | 0.2% | 2006 | |||||||
| Natural Gas | 73,882 million cu ft | 0.3% | 2006 | |||||||
| Coal | 11,531 thousand short tons | 1.0% | 2006 | |||||||
| by End-Use Sector | Montana | Share of U.S. | Period | |||||||
| Residential | 76,210 billion Btu | 0.4% | 2006 | |||||||
| Commercial | 69,107 billion Btu | 0.4% | 2006 | |||||||
| Industrial | 162,364 billion Btu | 0.5% | 2006 | |||||||
| Transportation | 121,386 billion Btu | 0.4% | 2006 | |||||||
| for Electricity Generation | Montana | Share of U.S. | Period | |||||||
| Petroleum | 6 thousand barrels | 0.1% | Sep-08 | |||||||
| Natural Gas | 59 million cu ft | 0.0% | Sep-08 | |||||||
| Coal | 939 thousand short tons | 1.1% | Sep-08 | |||||||
| for Home Heating (share of households) | Montana | U.S. Avg. | Period | |||||||
| Natural Gas | 59% | 51.2% | 2000 | |||||||
| Fuel Oil | 3% | 9.0% | 2000 | |||||||
| Electricity | 16% | 30.3% | 2000 | |||||||
| Liquefied Petroleum Gases | 13% | 6.5% | 2000 | |||||||
| Other/None | 9% | 1.8% | 2000 | |||||||
| Environment | ||||
| Special Programs | Montana | |||||||||
| Clean Cities Coalitions | None | |||||||||
| Alternative Fuels | Montana | Share of U.S. | Period | |||||||
| Alternative-Fueled Vehicles in Use | 2,023 | 0.3% | 2006 | |||||||
| Ethanol Plants | 0 | 0.0% | 2008 | |||||||
| Ethanol Plant Capacity | 0 million gal/year | 0.0% | 2008 | |||||||
| Ethanol Use in Gasohol | 1,631 thousand gal | 0.0% | 2004 | |||||||
| Electric Power Industry Emissions | Montana | Share of U.S. | Period | |||||||
| Carbon Dioxide |
19,086,919 metric tons | 0.8% | 2006 | |||||||
| Sulfur Dioxide |
21,776 metric tons | 0.2% | 2006 | |||||||
| Nitrogen Oxide |
37,902 metric tons | 1.0% | 2006 | |||||||
| — = No data reported; NA = Not available; W = Withheld to avoid disclosure of individual company data. |
|
||||||||||||||||||||||||||||||||||||||||||||||||||||||||||||||||||||||||||||||||||||||||||||||||||||||||||||||||||||||||||||||||||||||||||||||||||||||||||||||