|
|
|||
State Energy Profile - MichiganEnergy Information Administration - State Energy Profileshttp://tonto.eia.doe.gov/state |
||||||
|---|---|---|---|---|---|---|
|
||||||
|
Last Update: January 02, 2009
Next Update: January 08 , 2009 |
||||||
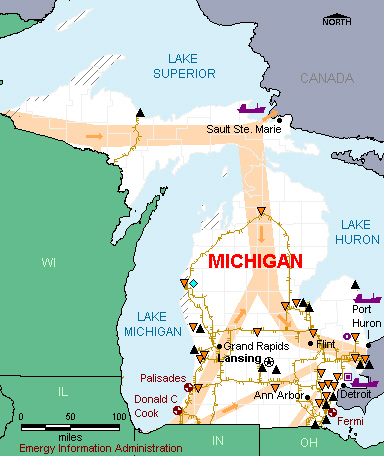
OverviewResources and ConsumptionMichigan has substantial natural gas reserves—more than any other State in the Great Lakes region—but is relatively limited in other energy resources. The State’s Antrim natural gas fields in the northern portion of the Lower Peninsula are among the largest in the United States. Michigan has some renewable energy potential, particularly from wood and wood waste in the northern portion of the State, wind energy near the Great Lakes shoreline and in the Thumb region of the State, and corn grown in southern Michigan. Michigan’s total energy consumption is high due in part to its large population, northern climate, and active industrial sector. Energy-intensive activities in the State include durable goods manufacturing, such as by the automotive, glass, and metal casting industries. PetroleumMichigan has some crude oil production from small wells scattered across the Lower Peninsula and one 102,000-barrel-per-day refinery in Detroit. Two major crude oil pipelines from western Canada, both part of the Lakehead Pipeline System, enter Michigan from the northwest and southwest and supply both Michigan and eastern Canada. Several petroleum product pipeline systems supply Michigan consumption markets, including the Wolverine Pipeline system, which runs from Chicago area refineries to the Detroit area. Michigan’s consumption of petroleum products, particularly liquefied petroleum gases (LPG), is high; Michigan is the largest residential LPG market in the Nation. Although Michigan does not require the use of motor gasoline blended with ethanol as many States do, the Detroit area requires the use of gasoline blended to reduce evaporative emissions that contribute to ozone formation. As a major corn producer, Michigan also has substantial ethanol production capacity, and additional plants are currently under construction. Natural GasNatural gas production in Michigan is substantial. Natural gas wells are concentrated in the Antrim field in the northern portion of the Lower Peninsula. Several major pipelines, including the Vector Pipeline from Illinois and the Great Lakes Gas Transmission line from western Canada, satisfy the remainder of the State's natural gas demand, as they cross Michigan on the way to markets in the U.S. Northeast and eastern Canada. With over one-tenth of U.S. capacity, Michigan has the most underground natural gas storage capacity in the Nation and supplies natural gas to neighboring States during high-demand winter months. Driven largely by the residential sector, Michigan’s natural gas consumption is high. Nearly four-fifths of Michigan households use natural gas as their primary energy source for home heating. Coal, Electricity, and RenewablesCoal dominates electricity generation in Michigan, supplying nearly three-fifths of the market. Most of the State’s coal is supplied by Wyoming and Montana and transported by rail to the western end of Lake Superior and then by ship to power plants largely located along the Great Lakes shoreline. Michigan also obtains coal, principally by rail, from eastern sources, including West Virginia, Kentucky, and Pennsylvania. Michigan's three nuclear power plants supply more than one-fourth of the State's electricity generation, while natural gas fuels much of the remainder. Although Michigan is a major generator of electricity from wood and wood waste, has many small hydroelectric plants, and has several plants that generate electricity using methane recovered from landfills and anaerobic digesters, renewable power generation contributes minimally to the State electricity grid. Electricity generation in Michigan is high, as is overall per capita electricity consumption. However, residential electricity use in Michigan is lower than the national average, in part due to low demand for air-conditioning during mild summers and to a reliance on natural gas for home heating. Less than one-tenth of Michigan households rely on electricity as their primary source of energy for home heating. Michigan currently has several ethanol and biodiesel production plants in operation, with many more plants currently under construction or planned. |
|
| Economy | ||||
| Population and Employment | Michigan | U.S. Rank | Period | |||||||
| Population | 10.1 million | 8 |
2007 | |||||||
| Civilian Labor Force | 5.0 million | 8 |
2007 | |||||||
| Per Capita Personal Income | $35,086 | 27 |
2007 | |||||||
| Industry | Michigan | U.S. Rank | Period | |||||||
| Gross Domestic Product by State | $382.0 billion | 12 | 2007 | |||||||
| Land in Farms | 10.1 million acres | 30 |
2002 | |||||||
| Market Value of Agricultural Products Sold | $3.8 billion | 22 |
2002 | |||||||
| Prices | ||||
| Petroleum | Michigan | U.S. Avg. | Period | |||||||
| Domestic Crude Oil First Purchase |
$99.66/barrel
|
$98.5/barrel | Sep-08 | |||||||
| No. 2 Heating Oil, Residential | $3.641/gal | $3.666/gal | Sep-08 | |||||||
| Regular Motor Gasoline Sold Through Retail Outlets (Excluding Taxes) | $3.263/gal | $3.207/gal | Sep-08 | |||||||
| State Tax Rate on Motor Gasoline (other taxes may apply) |
$0.19/gal | $0.2159/gal | Aug-08 | |||||||
| No. 2 Diesel Fuel Sold Through Retail Outlets (Excluding Taxes) | $3.523/gal | $3.484/gal | Sep-08 | |||||||
| State Tax Rate on On-Highway Diesel (other taxes may apply) |
$0.15/gal | $0.2214/gal | Aug-08 | |||||||
| Natural Gas | Michigan | U.S. Avg. | Period | |||||||
| Wellhead | NA | $6.40/thousand cu ft | 2006 | |||||||
| City Gate | $8.62/thousand cu ft | $8.96/thousand cu ft | Sep-08 | |||||||
| Residential | $16.94/thousand cu ft | $17.94/thousand cu ft | Sep-08 | |||||||
| Coal | Michigan | U.S. Avg. | Period | |||||||
| Average Open Market Sales Price | — | $26.20/short ton | 2007 | |||||||
| Delivered to Electric Power Sector | W | $ 2.16 /million Btu | Sep-08 | |||||||
| Electricity | Michigan | U.S. Avg. | Period | |||||||
| Residential | 11.01 cents/kWh | 11.94 cents/kWh | Sep-08 | |||||||
| Commercial | 9.43 cents/kWh | 10.77 cents/kWh | Sep-08 | |||||||
| Industrial | 7.11 cents/kWh | 7.36 cents/kWh | Sep-08 | |||||||
|
|||||||||||||||||||||||||
| Reserves | Michigan | Share of U.S. | Period | ||||||||||||||||||||||
| Crude Oil | 55 million barrels | 0.3% | 2007 | ||||||||||||||||||||||
| Dry Natural Gas | 3,630 billion cu ft | 1.5% | 2007 | ||||||||||||||||||||||
| Natural Gas Liquids | 55 million barrels | 0.6% | 2007 | ||||||||||||||||||||||
| Recoverable Coal at Producing Mines | — | — | 2007 | ||||||||||||||||||||||
| Rotary Rigs & Wells | Michigan | Share of U.S. | Period | ||||||||||||||||||||||
| Rotary Rigs in Operation | 2 | 0.1% | 2007 | ||||||||||||||||||||||
| Crude Oil Producing Wells | 3,871 | 0.8% | 2007 | ||||||||||||||||||||||
| Natural Gas Producing Wells | 9,200 | 2.1% | 2006 | ||||||||||||||||||||||
| Production | Michigan | Share of U.S. | Period | ||||||||||||||||||||||
| Total Energy | 765 trillion Btu | 1.1% | 2005 | ||||||||||||||||||||||
| Crude Oil | 538 thousand barrels | 0.5% | Jul-08 | ||||||||||||||||||||||
| Natural Gas - Marketed | 365,294 million cu ft | 1.9% | 2006 | ||||||||||||||||||||||
| Coal | — | — | 2007 | ||||||||||||||||||||||
| Capacity | Michigan | Share of U.S. | Period | ||||||||||||||||||||||
| Crude Oil Refinery Capacity (as of Jan. 1) | 102,000 barrels/calendar day | 0.6% | 2008 | ||||||||||||||||||||||
| Electric Power Industry Net Summer Capability | 30,189 MW | 3.1% | 2006 | ||||||||||||||||||||||
| Net Electricity Generation | Michigan | Share of U.S. | Period | ||||||||||||||||||||||
| Total Net Electricity Generation | 9,074 thousand MWh | 2.7% | Sep-08 | ||||||||||||||||||||||
| Petroleum-Fired | 21 thousand MWh | 0.7% | Sep-08 | ||||||||||||||||||||||
| Natural Gas-Fired | 662 thousand MWh | 0.9% | Sep-08 | ||||||||||||||||||||||
| Coal-Fired | 5,445 thousand MWh | 3.4% | Sep-08 | ||||||||||||||||||||||
| Nuclear | 2,611 thousand MWh | 3.9% | Sep-08 | ||||||||||||||||||||||
| Hydroelectric | 102 thousand MWh | 0.6% | Sep-08 | ||||||||||||||||||||||
| Other Renewables | 189 thousand MWh | 2.3% | Sep-08 | ||||||||||||||||||||||
| Stocks | Michigan | Share of U.S. | Period | ||||||||||||||||||||||
| Motor Gasoline (Excludes Pipelines) | 2,001 thousand barrels | 3.4% | Sep-08 | ||||||||||||||||||||||
| Distillate Fuel Oil (Excludes Pipelines) | 1,292 thousand barrels | 1.4% | Sep-08 | ||||||||||||||||||||||
| Natural Gas in Underground Storage | 992,361 million cu ft | 13.4% | Sep-08 | ||||||||||||||||||||||
| Petroleum Stocks at Electric Power Producers | 1,003 thousand barrels | 2.5 % | Sep-08 | ||||||||||||||||||||||
| Coal Stocks at Electric Power Producers | 6,897 thousand tons | 4.8% | Sep-08 | ||||||||||||||||||||||
| Production Facilities | Michigan | ||||||||||||||||||||||||
| Major Coal Mines | None | ||||||||||||||||||||||||
| Petroleum Refineries | Marathon Petroleum Co LLC (Detroit) | ||||||||||||||||||||||||
| Major Non-Nuclear Electricity Generating Plants | Monroe (Detroit Edison Co) • Ludington (Consumers Energy Co) • Midland Cogeneration Venture (Midland Cogeneration Venture) • Dan E Karn (Consumers Energy Co) • Belle River (Detroit Edison Co) | ||||||||||||||||||||||||
| Nuclear Power Plants | Donald C Cook (Indiana Michigan Power Co) • Fermi (Detroit Edison Co) • Palisades (Consumers Energy Co) | ||||||||||||||||||||||||
| Distribution & Marketing | ||||
| Distribution Centers | Michigan | |||||||||
| Oil Seaports/Oil Import Sites | Port Huron • Sault St. Marie • Detroit. | |||||||||
| Natural Gas Market Centers | None | |||||||||
| Major Pipelines | Michigan | |||||||||
| Crude Oil | Lakehead • Marathon • Shell. | |||||||||
| Petroleum Product | BP Amoco • Buckeye • Marathon • Ultramar-Diamond Shamrock • Wolverine. | |||||||||
| Liquefied Petroleum Gases | Cochin • Lakehead • Shell. | |||||||||
| Interstate Natural Gas Pipelines | ANR Pipeline Co. • ANR Storage Co. • Great Lakes Gas Transmission Ltd • Northern Natural Gas Co. • Panhandle Eastern Pipe Line Company • Vector Pipeline LP | |||||||||
| Fueling Stations | Michigan | Share of U.S. | Period | |||||||
| Motor Gasoline | 4,984 | 3.0% | 2007 | |||||||
| Liquefied Petroleum Gases | 79 | 3.4% | 2007 | |||||||
| Compressed Natural Gas | 14 | 1.8% | 2007 | |||||||
| Ethanol | 52 | 3.7% | 2007 | |||||||
| Other Alternative Fuels | 19 | 1.6% | 2007 | |||||||
| Consumption | ||||
| per Capita | Michigan | U.S. Rank | Period | |||||||
| Total Energy | 297 million Btu | 40 | 2006 | |||||||
| by Source | Michigan | Share of U.S. | Period | |||||||
| Total Energy | 2,998 trillion Btu | 3.0% | 2006 | |||||||
| Total Petroleum | 186,990 thousand barrels | 2.5% | 2006 | |||||||
| Motor Gasoline | 118,106 thousand barrels | 3.5% | 2006 | |||||||
| Distillate Fuel | 29,929 thousand barrels | 2.0% | 2006 | |||||||
| Liquefied Petroleum Gases | 15,036 thousand barrels | 2.0% | 2006 | |||||||
| Jet Fuel | 4,124 thousand barrels | 0.7% | 2006 | |||||||
| Natural Gas | 809,099 million cu ft | 3.5% | 2006 | |||||||
| Coal | W | W | 2006 | |||||||
| by End-Use Sector | Michigan | Share of U.S. | Period | |||||||
| Residential | 754,707 billion Btu | 3.6% | 2006 | |||||||
| Commercial | 602,554 billion Btu | 3.4% | 2006 | |||||||
| Industrial | 839,008 billion Btu | 2.6% | 2006 | |||||||
| Transportation | 801,684 billion Btu | 2.8% | 2006 | |||||||
| for Electricity Generation | Michigan | Share of U.S. | Period | |||||||
| Petroleum | 40 thousand barrels | 0.8% | Sep-08 | |||||||
| Natural Gas | 5,166 million cu ft | 0.8% | Sep-08 | |||||||
| Coal | 2,931 thousand short tons | 3.4% | Sep-08 | |||||||
| for Home Heating (share of households) | Michigan | U.S. Avg. | Period | |||||||
| Natural Gas | 78% | 51.2% | 2000 | |||||||
| Fuel Oil | 4% | 9.0% | 2000 | |||||||
| Electricity | 7% | 30.3% | 2000 | |||||||
| Liquefied Petroleum Gases | 9% | 6.5% | 2000 | |||||||
| Other/None | 2% | 1.8% | 2000 | |||||||
| Environment | ||||
| Special Programs | Michigan | |||||||||
| Clean Cities Coalitions | Ann Arbor • Detroit • Lansing | |||||||||
| Alternative Fuels | Michigan | Share of U.S. | Period | |||||||
| Alternative-Fueled Vehicles in Use | 14,437 | 2.4% | 2006 | |||||||
| Ethanol Plants | 4 | 2.8% | 2008 | |||||||
| Ethanol Plant Capacity | 112 million gal/year | 1.4% | 2008 | |||||||
| Ethanol Use in Gasohol | 165,864 thousand gal | 4.5% | 2004 | |||||||
| Electric Power Industry Emissions | Michigan | Share of U.S. | Period | |||||||
| Carbon Dioxide |
75,633,485 metric tons | 3.1% | 2006 | |||||||
| Sulfur Dioxide |
326,507 metric tons | 3.4% | 2006 | |||||||
| Nitrogen Oxide |
113,088 metric tons | 3.0% | 2006 | |||||||
| — = No data reported; NA = Not available; W = Withheld to avoid disclosure of individual company data. |
|
||||||||||||||||||||||||||||||||||||||||||||||||||||||||||||||||||||||||||||||||||||||||||||||||||||||||||||||||||||||||||||||||||||||||||||||||||||||||||||||