| Census Data and Emergency Preparedness |  |
||||||||||||||||||||||||||||||||||||||||||||||||||||||||||||||
| Skip this navigation | |||||||||||||||||||||||||||||||||||||||||||||||||||||||||||||||
|
Coastal Area Populations
2. A portion of an entire county accounts for at least 15 percent of a coastal cataloging unit. (i.e., an individual drainage basin). This definition does not require a county to contain any coastline, nor does it require counties to be within a certain distance of a coastline. Some coastal counties, such as San Bernardino, CA contain no coastline and extend hundreds of miles inland. In 2007, there were 673 coastal counties in the 50 states and the District
of Columbia, grouped here into 5 regions: North Atlantic (Maine through
Virginia), South Atlantic (North Carolina through Miami-Dade County, Florida),
Gulf of Mexico (Monroe County, Florida through Texas), Great Lakes, and
Pacific.
The coastal population has grown substantially since 1950:
In the 1950s the percentage population increase for coastal areas was
more than twice that of non-coastal areas. Since then, percentage gains
have been more similar for the two areas. Non-coastal areas have higher
rates of population growth in the 1970s, 1990s, and post-2000 era.
Between 1950 and 2007, the population increased 108.3% for coastal areas and 90.5% for non-coastal areas. Since 1970, the coastal counties share of the population has remained
at a relatively stable 52-54%. Demographic Components of Population Change: 2000 to 2007
Much of the net domestic out-migration from the coastal areas was from only a few large counties. Nineteen populous counties had net domestic out-migration of 100,000 or more between 2000 and 2007; collectively, their net domestic out-migration totaled 4.8 million people.
(Density calculations exclude Alaska whose large coastal land area skews national analysis of population density). 19 of the 20 US counties with the highest population densities are coastal; the noncoastal exception is St. Louis city Missouri, whose population density of 5,666.5 ranked it 15 nationally. In the South Atlantic and Gulf regions, many coastal counties with already high population densities have continued to grow. In the northeast and Midwest, the most densely populated coastal counties often contain older industrial cities such as Cleveland, Detroit, or Milwaukee and have little or no population growth in recent decades.
Coastal Population Maps
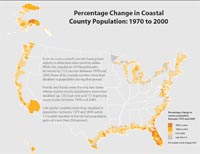
Between 1970 and 2000 the number of seasonal homes in the United States increased from one million to 3.6 million. Of the 2.6 million gained, 1.4 million was in coastal counties and 1.2 million occurred in non-coastal areas. In 2000, seasonal homes represented 3.3 percent of all housing units in coastal areas, up from 1.6% in 1970. Seasonal homes constituted 2.9% of all housing units in non-coastal areas, up from 1.4% in 1970. Between 1970 and 2000 the number of seasonal housing units in coastal counties increased by 237 percent, somewhat less than the 267 percent increase for non-coastal areas. Source: Decennial Censuses of 1950, 1970, and 2000; Population Estimates Program’s 2007 Estimates. The data are subject to nonsampling error, which may be introduced during any of the various complex operations (editing, reviewing, or handling questionnaires) used to collect and process Census data. |
||||||||||||||||||||||||||||||||||||||||||||||||||||||||||||||
 The
number of Americans residing in a coastal county passed the 150 million
mark in 2005, making the coastal population larger than the entire U.S.
population in 1950.
The
number of Americans residing in a coastal county passed the 150 million
mark in 2005, making the coastal population larger than the entire U.S.
population in 1950.