|
State Energy Profile - New YorkEnergy Information Administration - State Energy Profileshttp://tonto.eia.doe.gov/state |
||||||
---|---|---|---|---|---|---|
|
||||||
Last Update: January 02, 2009
Next Update: January 08 , 2009 |
||||||
OverviewResources and ConsumptionNew York has minor reserves of oil and gas, found primarily in the far western part of the State approaching Lake Erie. Although New York’s fossil fuel resources are limited, the State possesses considerable renewable energy potential. Several powerful rivers, including the Niagara and the Hudson, provide New York with some of the greatest hydropower resources in the country, and New York’s Catskill and Adirondack Mountains offer substantial wind power potential. In addition, parts of New York are densely forested, allowing for potential fuelwood harvesting. Although New York’s total energy consumption is among the highest in the United States, per capita energy consumption is among the lowest, due in part to the region’s widely used mass transportation systems. The commercial and residential sectors lead State energy demand; the transportation and industrial sectors are also major consumers. Petroleum
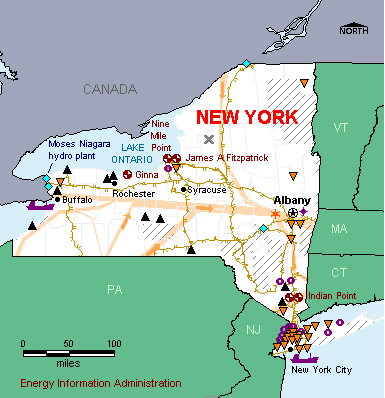
New York’s petroleum products are supplied by regional refineries located in New Jersey and Pennsylvania, the Colonial Pipeline system from the Gulf Coast, and foreign imports that principally originate in Canada, the Caribbean, South America, and Europe. Located in both New York and New Jersey, the New York Harbor area has a refined product storage capacity of over 40 million barrels, making it the largest and most important petroleum product hub in the high-demand Northeast. New York Harbor acts as a central distribution center for the region, and many of the petroleum products delivered to the Harbor are later redistributed to smaller ports where they supply local demand. In particular, the Hudson River, which meets the Atlantic Ocean in New York Harbor, provides a major inland water route for petroleum product barges supplying eastern New York and parts of western New England. On the other side of the State, western New York product markets are primarily supplied from Canada at the Port of Buffalo, and via the Buckeye and Sunoco pipeline systems from Pennsylvania and the Midwest. The TEPPCO pipeline system from the Gulf Coast delivers mostly propane to upstate markets. As in many northeastern urban areas, New York City and the surrounding metropolitan areas require reformulated gasoline blended with ethanol, and the New York Harbor area is the primary Northeast distribution hub for ethanol supplies. In particular, Sewaren, located on the New Jersey side of the Harbor, receives ethanol rail shipments from the Midwest and marine imports from Brazil and the Caribbean, and then it redistributes these supplies to markets throughout the Northeast. Another large ethanol storage facility serving the Northeast is located in Albany, New York. New York, along with much of the Northeast, is vulnerable to distillate fuel oil shortages and price spikes during winter months due to high demand for home heating. One-third of New York households use fuel oil as their primary energy source for home heating. In January and February 2000, distillate fuel oil prices in the Northeast rose sharply when extreme winter weather increased demand unexpectedly and hindered the arrival of new supply, as frozen rivers and high winds slowed the docking and unloading of barges and tankers. In July 2000, in order to reduce the risk of future shortages, the President directed the U.S. Department of Energy to establish the Northeast Heating Oil Reserve. The Reserve would give Northeast consumers adequate supplies for about 10 days, the time required for ships to carry heating oil from the Gulf of Mexico to New York Harbor. The Reserve’s largest storage site, with an inventory of 1 million barrels, is located in Woodbridge, New Jersey, just south of New York City. Natural GasAlthough western New York produces a small amount of natural gas, the vast majority of New York’s natural gas supply is brought in via pipeline from other States and Canada., The Transcontinental and Tennessee Gas Transmission pipelines from the Gulf Coast and the Iroquois pipeline from Canada link up with local gas distribution networks that supply the New York City metropolitan area and Long Island. Numerous other gas transmission systems branch in from Pennsylvania and Canada to feed other parts of the State. New York has moderate natural gas storage capacity, which was developed principally from depleted natural gas fields in the Appalachian Basin in western New York. These storage sites, along with those in Pennsylvania, Ohio, and West Virginia, are important for supplying the Northeast region, particularly during the peak demand winter season. New York’s residential, commercial, and electric power sectors all consume large amounts of natural gas. To meet New York and Connecticut’s growing demand for natural gas, particularly for electric power generation, a joint venture has proposed building a 1.0 billion cubic-feet-per-day liquefied natural gas (LNG) import terminal on the Long Island Sound. Coal, Electricity, and Renewables
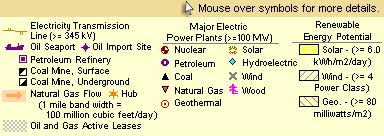
Unlike many States, New York does not rely heavily on any one fuel for electricity generation. Nuclear power, produced at New York’s four nuclear plants, is the leading generation fuel, typically accounting for about three-tenths of State generation. However, four other energy sources (natural gas, hydroelectric, coal, and petroleum) each account for a substantial share of the power generated in the State. New York is also a major net importer of electricity from neighboring States and Canada. New York is one of the top hydroelectric power producers in the country, and its hydroelectric generation is the highest of any State east of the Rocky Mountains. When New York’s Robert Moses Niagara plant opened near the Niagara River in 1961, it was the largest hydroelectric generation facility in the world. Today, the 2,253-megawatt power plant is still New York’s second largest electricity generator. Nonhydroelectric renewable energy sources contribute only minimally to the State power grid, although New York is one of the Nation's top generators of electricity from municipal solid waste and landfill gas. The average New York household consumes about one-half the electricity of the average U.S. household, largely because few use electricity as their primary energy source for home heating and because demand for air-conditioning is low during typically mild summer months. Various failures led to major electricity outages affecting New York in 1965, 1977, and 2003. The August 2003 blackout was the most severe blackout in North American history, affecting an estimated 50 million people in the U.S. Northeast and eastern Canada. For safety reasons, nuclear power plants are required by Federal law to shut down if back-up power systems fail, and all four of New York’s nuclear power plants were forced offline. As a result, almost the entire State of New York lost power during the incident. |
Economy | ||||
Population and Employment | New York | U.S. Rank | Period | |||||||
Population | 19.3 million | 3 |
2007 | |||||||
Civilian Labor Force | 9.5 million | 3 |
2007 | |||||||
Per Capita Personal Income | $47,385 | 5 |
2007 | |||||||
Industry | New York | U.S. Rank | Period | |||||||
Gross Domestic Product by State | $1103.0 billion | 3 | 2007 | |||||||
Land in Farms | 7.7 million acres | 36 |
2002 | |||||||
Market Value of Agricultural Products Sold | $3.1 billion | 26 |
2002 | |||||||
Prices | ||||
Petroleum | New York | U.S. Avg. | Period | |||||||
Domestic Crude Oil First Purchase |
W
|
$98.5/barrel | Sep-08 | |||||||
No. 2 Heating Oil, Residential | $3.725/gal | $3.666/gal | Sep-08 | |||||||
Regular Motor Gasoline Sold Through Retail Outlets (Excluding Taxes) | $3.105/gal | $3.207/gal | Sep-08 | |||||||
State Tax Rate on Motor Gasoline (other taxes may apply) |
$0.2445/gal | $0.2159/gal | Aug-08 | |||||||
No. 2 Diesel Fuel Sold Through Retail Outlets (Excluding Taxes) | $3.64/gal | $3.484/gal | Sep-08 | |||||||
State Tax Rate on On-Highway Diesel (other taxes may apply) |
$0.2265/gal | $0.2214/gal | Aug-08 | |||||||
Natural Gas | New York | U.S. Avg. | Period | |||||||
Wellhead | $7.13/thousand cu ft | $6.40/thousand cu ft | 2006 | |||||||
City Gate | $9.34/thousand cu ft | $8.96/thousand cu ft | Sep-08 | |||||||
Residential | $22.16/thousand cu ft | $17.94/thousand cu ft | Sep-08 | |||||||
Coal | New York | U.S. Avg. | Period | |||||||
Average Open Market Sales Price | — | $26.20/short ton | 2007 | |||||||
Delivered to Electric Power Sector | $ 2.57/million Btu | $ 2.16 /million Btu | Sep-08 | |||||||
Electricity | New York | U.S. Avg. | Period | |||||||
Residential | 19.42 cents/kWh | 11.94 cents/kWh | Sep-08 | |||||||
Commercial | 17.97 cents/kWh | 10.77 cents/kWh | Sep-08 | |||||||
Industrial | 10.48 cents/kWh | 7.36 cents/kWh | Sep-08 | |||||||
|
|||||||||||||||||||||||||
Reserves | New York | Share of U.S. | Period | ||||||||||||||||||||||
Crude Oil | — | — | 2007 | ||||||||||||||||||||||
Dry Natural Gas | 376 billion cu ft | 0.2% | 2007 | ||||||||||||||||||||||
Natural Gas Liquids | — | — | 2007 | ||||||||||||||||||||||
Recoverable Coal at Producing Mines | — | — | 2007 | ||||||||||||||||||||||
Rotary Rigs & Wells | New York | Share of U.S. | Period | ||||||||||||||||||||||
Rotary Rigs in Operation | 6 | 0.3% | 2007 | ||||||||||||||||||||||
Crude Oil Producing Wells | 3,190 | 0.6% | 2007 | ||||||||||||||||||||||
Natural Gas Producing Wells | 5,985 | 1.3% | 2006 | ||||||||||||||||||||||
Production | New York | Share of U.S. | Period | ||||||||||||||||||||||
Total Energy | 924 trillion Btu | 1.3% | 2005 | ||||||||||||||||||||||
Crude Oil | 37 thousand barrels | 0.0% | Jul-08 | ||||||||||||||||||||||
Natural Gas - Marketed | 55,980 million cu ft | 0.3% | 2006 | ||||||||||||||||||||||
Coal | — | — | 2007 | ||||||||||||||||||||||
Capacity | New York | Share of U.S. | Period | ||||||||||||||||||||||
Crude Oil Refinery Capacity (as of Jan. 1) | 0 barrels/calendar day | 0.0% | 2008 | ||||||||||||||||||||||
Electric Power Industry Net Summer Capability | 39,550 MW | 4.0% | 2006 | ||||||||||||||||||||||
Net Electricity Generation | New York | Share of U.S. | Period | ||||||||||||||||||||||
Total Net Electricity Generation | 11,813 thousand MWh | 3.5% | Sep-08 | ||||||||||||||||||||||
Petroleum-Fired | 125 thousand MWh | 4.2% | Sep-08 | ||||||||||||||||||||||
Natural Gas-Fired | 4,218 thousand MWh | 5.4% | Sep-08 | ||||||||||||||||||||||
Coal-Fired | 1,785 thousand MWh | 1.1% | Sep-08 | ||||||||||||||||||||||
Nuclear | 3,382 thousand MWh | 5.0% | Sep-08 | ||||||||||||||||||||||
Hydroelectric | 2,028 thousand MWh | 12.3% | Sep-08 | ||||||||||||||||||||||
Other Renewables | 222 thousand MWh | 2.7% | Sep-08 | ||||||||||||||||||||||
Stocks | New York | Share of U.S. | Period | ||||||||||||||||||||||
Motor Gasoline (Excludes Pipelines) | 1,124 thousand barrels | 1.9% | Sep-08 | ||||||||||||||||||||||
Distillate Fuel Oil (Excludes Pipelines) | 5,462 thousand barrels | 5.8% | Sep-08 | ||||||||||||||||||||||
Natural Gas in Underground Storage | 207,842 million cu ft | 2.8% | Sep-08 | ||||||||||||||||||||||
Petroleum Stocks at Electric Power Producers | 5,615 thousand barrels | 14.1 % | Sep-08 | ||||||||||||||||||||||
Coal Stocks at Electric Power Producers | 759 thousand tons | 0.5% | Sep-08 | ||||||||||||||||||||||
Production Facilities | New York | ||||||||||||||||||||||||
Major Coal Mines | None | ||||||||||||||||||||||||
Petroleum Refineries | None | ||||||||||||||||||||||||
Major Non-Nuclear Electricity Generating Plants | Robert Moses Niagara (New York Power Authority) • Ravenswood (KeySpan-Ravenswood Inc) • Oswego Harbor Power (NRG Oswego Harbor Power Operations Inc) • Northport (KeySpan Generation LLC) • Astoria Generating Station (U S Power Generating Company LLC) | ||||||||||||||||||||||||
Nuclear Power Plants | Nine Mile Point Nuclear Station (Nine Mile Point Nuclear Sta LLC) • Indian Point 3 (Entergy Nuclear Indian Point 3) • Indian Point 2 (Entergy Nuclear Indian Point 2) • James A Fitzpatrick (Entergy Nuc Fitzpatrick LLC) • R. E. Ginna Nuclear Power Plant (R.E. Ginna Nuclear Power Plant • LLC) | ||||||||||||||||||||||||
Distribution & Marketing | ||||
Distribution Centers | New York | |||||||||
Oil Seaports/Oil Import Sites | New York • Buffalo • Albany | |||||||||
Natural Gas Market Centers | Iroquois Center (Market Center) | |||||||||
Major Pipelines | New York | |||||||||
Crude Oil | Kiantone | |||||||||
Petroleum Product | Buckeye • Sunoco. | |||||||||
Liquefied Petroleum Gases | TEPPCO | |||||||||
Interstate Natural Gas Pipelines | Algonquin Gas Transmission Co. • Columbia Gas Transmission corp. • Dominion Transmission Co. • Iroquois Pipeline Co. • Tennessee Gas Pipeline Co. • Texas Eastern Transmission Corp. • Transcontinental Gas Pipeline Co. | |||||||||
Fueling Stations | New York | Share of U.S. | Period | |||||||
Motor Gasoline | 6,700 | 4.1% | 2007 | |||||||
Liquefied Petroleum Gases | 28 | 1.2% | 2007 | |||||||
Compressed Natural Gas | 98 | 12.4% | 2007 | |||||||
Ethanol | 8 | 0.6% | 2007 | |||||||
Other Alternative Fuels | 10 | 0.9% | 2007 | |||||||
Consumption | ||||
per Capita | New York | U.S. Rank | Period | |||||||
Total Energy | 204 million Btu | 50 | 2006 | |||||||
by Source | New York | Share of U.S. | Period | |||||||
Total Energy | 3,940 trillion Btu | 4.0% | 2006 | |||||||
Total Petroleum | 292,622 thousand barrels | 3.9% | 2006 | |||||||
Motor Gasoline | 140,020 thousand barrels | 4.1% | 2006 | |||||||
Distillate Fuel | 75,871 thousand barrels | 5.0% | 2006 | |||||||
Liquefied Petroleum Gases | 7,152 thousand barrels | 1.0% | 2006 | |||||||
Jet Fuel | 20,341 thousand barrels | 3.4% | 2006 | |||||||
Natural Gas | 1,097,040 million cu ft | 4.8% | 2006 | |||||||
Coal | W | W | 2006 | |||||||
by End-Use Sector | New York | Share of U.S. | Period | |||||||
Residential | 1,133,257 billion Btu | 5.5% | 2006 | |||||||
Commercial | 1,250,179 billion Btu | 7.1% | 2006 | |||||||
Industrial | 461,671 billion Btu | 1.4% | 2006 | |||||||
Transportation | 1,094,842 billion Btu | 3.8% | 2006 | |||||||
for Electricity Generation | New York | Share of U.S. | Period | |||||||
Petroleum | 234 thousand barrels | 4.6% | Sep-08 | |||||||
Natural Gas | 37,026 million cu ft | 5.9% | Sep-08 | |||||||
Coal | 819 thousand short tons | 1.0% | Sep-08 | |||||||
for Home Heating (share of households) | New York | U.S. Avg. | Period | |||||||
Natural Gas | 52% | 51.2% | 2000 | |||||||
Fuel Oil | 33% | 9.0% | 2000 | |||||||
Electricity | 9% | 30.3% | 2000 | |||||||
Liquefied Petroleum Gases | 3% | 6.5% | 2000 | |||||||
Other/None | 3% | 1.8% | 2000 | |||||||
Environment | ||||
Special Programs | New York | |||||||||
Clean Cities Coalitions | Capital District (Albany) • Central New York • Genesee Region (Rochester) • Greater Long Island • Clean Communities of Western New York • New York City | |||||||||
Alternative Fuels | New York | Share of U.S. | Period | |||||||
Alternative-Fueled Vehicles in Use | 28,064 | 4.7% | 2006 | |||||||
Ethanol Plants | 0 | 0.0% | 2008 | |||||||
Ethanol Plant Capacity | 0 million gal/year | 0.0% | 2008 | |||||||
Ethanol Use in Gasohol | 303,526 thousand gal | 8.3% | 2004 | |||||||
Electric Power Industry Emissions | New York | Share of U.S. | Period | |||||||
Carbon Dioxide |
50,961,141 metric tons | 2.1% | 2006 | |||||||
Sulfur Dioxide |
121,872 metric tons | 1.3% | 2006 | |||||||
Nitrogen Oxide |
64,044 metric tons | 1.7% | 2006 | |||||||
— = No data reported; NA = Not available; W = Withheld to avoid disclosure of individual company data. |
|