|
Annual Energy Outlook 2008 (Early Release) |
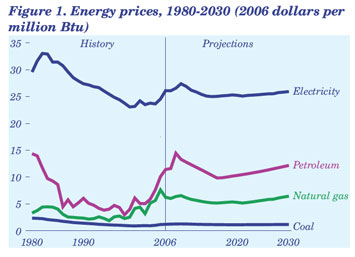
Energy Prices EIA raised the reference case path for world oil prices in AEO2008 (although the upward adjustment is smaller than the last major adjustment, introduced in AEO2006). The real world crude oil price (which for the purposes of AEO2008 is defined as the price of light, low-sulfur crude oil delivered in Cushing, Oklahoma, in 2006 dollars) declines gradually from current levels to $57 per barrel in 2016 ($68 per barrel in nominal dollars), as expanded investment in exploration and development brings new supplies to world markets. After 2016, real prices begin to rise (Figure 1), as demand continues to grow and higher cost supplies are brought to market. In 2030, the average real price of crude oil is $70 per barrel in 2006 dollars, or about $113 per barrel in nominal dollars. Alternative AEO2008 cases address higher and lower world crude oil prices. In developing its oil price outlook, EIA explicitly considered four factors: (1) growth in world liquids consumption; (2) the outlook for conventional oil production in countries outside the Organization of the Petroleum Exporting Countries (OPEC); (3) growth in unconventional liquids production; and (4) OPEC behavior. With the forces driving demand outside the United States as strong as, or stronger than, previously expected but with global supply projections somewhat weaker, oil prices in AEO2008 are higher than projected in AEO2007 [2]. As a result of recent strong economic growth world-wide, transitory shortages of experienced personnel, equipment, and construction materials in the oil industry, and political instability in some major producing regions, oil prices currently are above EIA’s estimate of the long-run equilibrium price. EIA’s expectations regarding the ultimate size of both conventional and unconventional liquid resources have not changed since last year’s AEO. The AEO2008 reference case represents EIA’s current judgment about the most likely behavior of key OPEC members in the mid-term. In the projection, OPEC countries increase production at a rate that keeps their market share of world liquids production at approximately 40 percent through 2030. The AEO2008 reference case also projects significant long-term potential for supply from non-OPEC producers. In several resource-rich regions—including Brazil, Azerbaijan, and Kazakhstan—high oil prices, expanded infrastructure, and new exploration and drilling technologies permit additional non-OPEC oil production. Also, with the economic viability of Canada’s oil sands enhanced by higher world oil prices and advances in production technology, oil sands production is expected to reach 4 million barrels per day in 2030. The price of natural gas also is higher in the AEO2008 reference case. The real wellhead price of natural gas (in 2006 dollars) declines from current levels through 2016, as new supplies enter the market. After some fluctuations through 2021, real natural gas prices rise to $6.63 per thousand cubic feet in 2030 ($10.64 per thousand cubic feet in nominal dollars). The higher prices in the AEO2008 reference case reflect an increase in production costs associated with recent trends that were discussed in AEO2007 but were not reflected fully in the AEO2007 reference case [3]. The higher natural gas prices also are supported by higher oil prices. Minemouth coal prices in the AEO2008 reference case, both nationally and regionally, are generally similar to those projected in the AEO2007 reference case. By region, the largest price difference is for Wyoming’s Powder River Basin, where the projected average minemouth price in 2030 is 12.1 percent above the AEO2007 projection, at $0.66 (2006 dollars) per million British thermal units (Btu), reflecting a less optimistic outlook for improvements in coal mining productivity. Average real minemouth coal prices (in 2006 dollars) fall from $1.21 per million Btu ($24.63 per short ton) in 2006 to $1.14 per million Btu ($22.45 per short ton) in 2018 in the AEO2008 reference case, as prices moderate following a substantial run-up over the past few years. After 2020, coal prices rise as demand increases, reaching $1.19 per million Btu ($23.32 per short ton) in 2030. The 2020 and 2030 price projections are 2.6 percent and 0.9 percent higher, respectively, than those in the AEO2007 reference case. Without adjustment for inflation, the average mine-mouth price of coal in the AEO2008 reference case is $1.91 per million Btu ($37.42 per ton) in 2030. AEO2008 projects higher prices for most energy fuels delivered to consumers. For example, in 2030, the average delivered price of natural gas (in 2006 dollars) is more than $1 per million Btu higher in the AEO2008 reference case than was projected in AEO2007. In part, the higher delivered prices result from higher prices paid to fossil fuel producers at the wellhead or minemouth; but they also result from updates made to assumptions about the costs to transport, distribute, and refine the fuels to make them more consistent with recent trends. For example, as a result of declining use per customer and the growing cost of bringing supplies from new regions to market, margins between the delivered and wellhead prices of natural gas are higher than previously projected. Factors contributing to higher margins for liquid fuels include continued growth in the use of heavier and sourer crudes, growing demand for cleaner products, and the rising cost of refinery safety and emissions abatement. Increases in diesel fuel prices in recent years have led railroads to implement fuel adjustment surcharges on coal shipments, which are incorporated in the AEO2008 reference case. The average real delivered price of coal to power plants (in 2006 dollars) increases from $1.69 per million Btu ($33.85 per short ton) in 2006 to $1.78 per million Btu ($35.03 per short ton) in 2030, 2.3 percent higher than in the AEO2007 reference case. In nominal dollars, the average delivered price of coal to power plants is projected to reach $2.86 per million Btu ($56.22 per short ton) in 2030. Electricity prices follow trends in the delivered prices of fuels to power plants in the reference case. From a peak of 9.3 cents per kilowatthour (2006 dollars) in 2009, average delivered electricity prices decline to 8.5 cents per kilowatthour in 2015 and then increase to 8.8 cents per kilowatthour in 2030. In the AEO2007 reference case, with slightly lower expectations for delivered fuel prices and construction costs for all new technologies, electricity prices reached 8.3 cents per kilowatthour (2006 dollars) in 2030. In nominal dollars, the average delivered electricity price in the AEO2008 reference case reaches 14.1 cents per kilowatthour in 2030.
|