15th Anniversary of Americans
with Disabilities Act: July 26, 2005
On this day in 1990, President George H.W. Bush signed into law the Americans
with Disabilities Act, guaranteeing equal opportunity for people with
disabilities in public accommodations, commercial facilities, employment,
transportation, state and local government services and telecommunications. |

Population Distribution
37.5 million
Number of people age 5 and over in the civilian noninstitutionalized population
with at least one disability, representing 14 percent. These individuals
fit at least one of the following descriptions: they are 5 years old or
older and have a sensory, physical, mental or self-care disability; they
are 16 years old or older and have difficulty going outside the home; or
they are 16 to 64 years old and have an employment disability.
By age and sex —
- 8 percent of boys and 4 percent of girls ages 5 to 15 have disabilities.
- 12 percent of men and 11 percent of women ages 16 to 64 have disabilities.
This apparent difference is not statistically significant.
- 42 percent of women and 38 percent of men 65 or older have disabilities.
42%
Percentage of working-age men (21 to 64) with disabilities who are employed.
For women, the rate is 34 percent. Altogether, 4.0 million men and 3.5
million women with disabilities are employed.
847,000
Number of people ages 18 to 34 who have disabilities and are enrolled
in school. They comprise 5 percent of all students in this age group.
The majority of this group (567,000) attend college or graduate school.
More
information on the data appearing in the “Population Distribution”
section.
Serving Our Nation
2.5 million
Number of veterans
who received compensation for service-related disabilities as of 2003
[PDF]. Of these vets, 414,000 served in World War II; 164,000 in Korea;
848,000 in Vietnam; and 476,000 in the Persian Gulf (the data cover service
from Aug. 2, 1990 to Sept. 30, 2003). |
Specific
Disabilities
10.8 million
The number of people age 5 or older with a sensory disability involving
sight or hearing. This group accounts for 4.1 percent of the civilian noninstitutionalized
population age 5 or older.
23.6 million
The number of people age 5 or older with a condition limiting basic physical
activities, such as walking, climbing stairs, reaching, lifting or carrying.
This group accounts for 9.0 percent of the civilian noninstitutionalized
population age 5 or older.
13.5 million
The number of people age 5 or older with a physical, mental or emotional
condition causing difficulty in learning, remembering or concentrating.
This group accounts for 5.1 percent of the civilian noninstitutionalized
population age 5 or older.
7.0 million
Number of people age 5 or older who have a physical, mental or emotional
condition causing difficulty in dressing, bathing or moving around inside
the home. This group accounts for 2.7 percent of the civilian noninstitutionalized
population age 5 or older.
10.7 million
Number of people age 16 or older who have a condition that makes it difficult
to go outside the home to shop or visit a doctor. This group accounts
for 4.9 percent of civilian noninstitutionalized people who are of this
age.
11.8 million
Number of people ages 16 to 64 who have a condition that affects their
ability to work at a job or business. They account for 6.4 percent of
civilian noninstitutionalized people in this age group.
More
information on the data appearing in the “Specific Disabilities”
section. |
Individual source links for each statement
herein may be accessed on the Internet at
<http://www.census.gov/Press-Release/www/releases/archives/facts_for_features_special_editions/004998.html>.
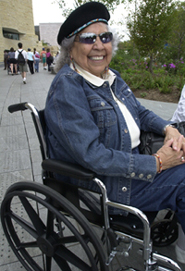
The photos
herein may be downloaded and are available free for your use in all
print and broadcast products.
Please credit the U.S. Census Bureau. For product information, call (301)
763-3011 or e-mail <pio.broadcast.services@census.gov>.
Editor’s note: Some of the preceding data were
collected in surveys and, therefore, are subject to sampling error. Questions
or comments should be directed to the Census Bureau’s Public Information
Office at (301) 763-3030; fax (301) 457-3670; or e-mail <pio@census.gov>.
|