*Special Edition*
National Nurses Week (May 6-12) and
National Hospital Week (May 8-14)
National Nurses Week coincides with Florence Nightingale’s birthday,
May 12. Many consider Nightingale the founder of modern nursing. The history
of Nurses Week began in 1953 when Dorothy Sutherland of the U.S. Department
of Health, Education and Welfare sent the proposal to President Eisenhower.
In 1974, President Nixon proclaimed a “National Nurse Week.”
The celebration of National Hospital Week began in 1921 when a magazine
editor suggested that more information about hospitals might alleviate
public fears about them. |
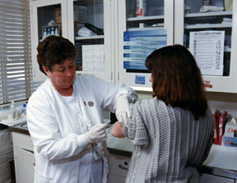
Nurses in the
United States
2.4 million
Number of registered nurses [PDF].
92%
Percentage of registered nurses who are women
[PDF].
623,000
Projected growth in the number of registered
nurses [PDF] between 2002 and 2012. It is expected that registered
nurses will experience the largest job growth of any occupation during
this time period.
531,000
Number of licensed practical and licensed
vocational nurses [PDF].
1,181
Number of nurses [PDF] per 100,000 residents
in Massachusetts, the highest rate among states. (The District of Columbia
has 1,498.) Nevada, with 517, has the lowest rate.
1.8 million
Number of nursing, psychiatric and home health
aides [PDF].
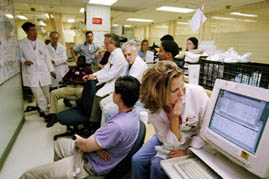
 Hospitals Hospitals
7,569
Number of hospitals
nationwide. These hospitals employ 5.1 million people.
$536.3 billion
Estimated annual
revenue in 2003 for hospitals, up 6 percent from 2002. Major sources
of revenue were private insurance ($204 billion, up 8 percent), Medicare
($167 billion, up 2 percent) and Medicaid ($65 billion, up 7 percent).
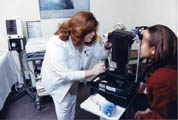
At a Hospital
You may encounter [PDF] one of the nation’s
819,000 physicians and surgeons; 77,000 occupational therapists; 182,000
physical therapists; or 94,000 respiratory therapists.
|
Health Insurance
243.3 million
The number of people with health
insurance coverage in 2003, an increase of 1.0 million from 2002. The
percentage of the population with health insurance in 2003 was 84.4 percent,
down from the 84.8 percent with coverage in 2002.
91.8%
The percentage of people with health insurance coverage in 2003 among
people
living in households with incomes of $75,000 or more. The likelihood
of being covered by health insurance rises with income, as the corresponding
rate for people with annual household incomes of less than $25,000 was
75.8 percent.
82.5%
The percentage
of full-time workers age 18 to 64 covered by health insurance in 2003,
higher than the rate for part-time workers (76.2 percent) or nonworkers
(74.0 percent).
60.4% and
174.0 million
The percentage and number of people
covered by employment-based health insurance in 2003, down from 61.3
percent and 175.3 million in 2002. This decline essentially explains the
fall in total private health insurance coverage over the period, from
69.6 percent to 68.6 percent.
26.6% and
76.8 million
The percentage and number of people
covered by government health insurance programs in 2003, up from 25.7
percent and 73.6 million in 2002. |
33.7 million
Number of hospital inpatient discharges in
2002 [PDF], amounting to 118 per every 1,000 residents. The average
hospital stay lasts about five days. On any given day, there are 539,000
hospital inpatients [PDF], nationwide,
excluding newborns.
$7,346
Average cost to community hospitals per
patient [PDF], per stay.
110.2 million
Number of visits annually to hospital emergency
rooms [PDF]. That amounts to 39 for every 100 people. |
No Health Insurance
45.0 million
The number
of people without health insurance coverage in 2003, up from 43.6 million
in 2002. The percentage of people without coverage also rose, from 15.2
percent in 2002 to 15.6 percent in 2003.
11.4%
The proportion
of children (under 18 years old) without health insurance coverage
in 2003. These uninsured children totaled 8.4 million. Neither the rate
nor the number changed significantly between 2002 and 2003.
8.2%
The proportion
of Minnesota residents who lack health insurance, based on a 2001-2003
average. While Minnesota has the lowest proportion of residents who are
uninsured, Texas (24.6 percent) and New Mexico (21.3 percent) have the
highest and second highest proportions of uninsured. |
| Individual source links for
each statement herein may be accessed on the Internet at
<http://www.census.gov/Press-Release/www/releases/archives/facts_for_features_special_editions/004491.html>.
The photos
herein may be downloaded and are available free for your use in all
print and broadcast products.
Please credit the U.S. Census Bureau. For product information, call (301)
763-3011 or e-mail <pio.broadcast.services@census.gov>.
Editor’s note: Some of the preceding data were
collected in surveys and, therefore, are subject to sampling error. Questions
or comments should be directed to the Census Bureau’s Public Information
Office at (301) 763-3030; fax (301) 457-3670; or e-mail <pio@census.gov>.
|
