
![]()
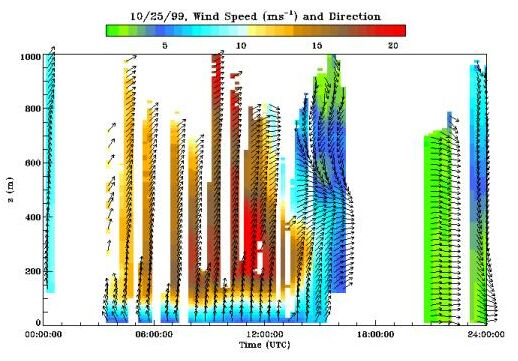 |
Wind speed and direction (48 KB file) |
This time-height display shows wind speed and direction as derived from HRDL scan data. Wind speed is represented in color and the wind VECTOR directions are represented by arrows. |
 |
Animation 1 (660 KB file) |
This animation shows streaky turbulence structures often observed near the surface when the low-level-jet was strong. |
 |
Animation 2 (1,410 KB file) |
This animation shows the erosion of the low-level-jet as a result of developing convection during the morning transition period. |
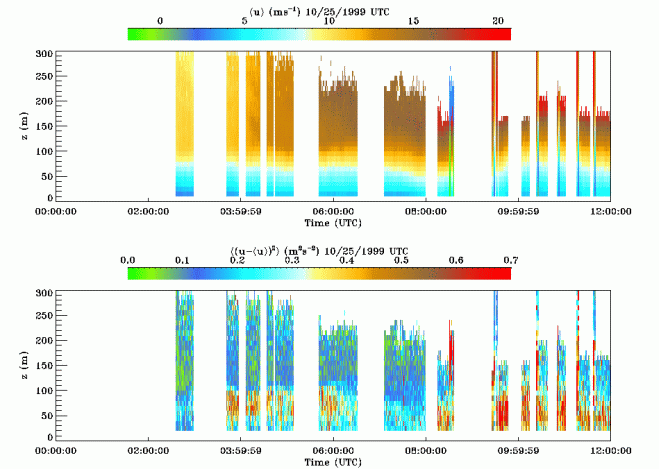 |
RHI Statistics (25 KB file) |
These time-height displays show the mean horizontal wind velocity (top) and horizontal wind variance (bottom) derived from HRDL RHI scan data. These data were obtained by averaging individual RHI scans horizontally within 10 m vertical bins. |
 |
Time series (36 KB file) |
Time series plots of Low Level Jet (LLJ) characteristics. |
![]()