
![]()
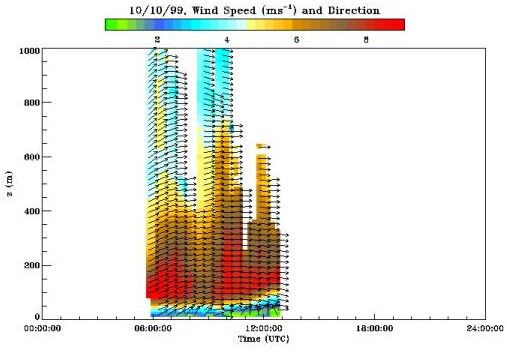 |
Wind speed and direction (29 KB file) |
This time-height display shows wind speed and direction as derived from HRDL scan data. Wind speed is represented in color and the wind VECTOR directions are represented by arrows. |
 |
RHI Statistics (17 KB file) |
These time-height displays show the mean horizontal wind velocity (top) and horizontal wind variance (bottom) derived from HRDL RHI scan data. These data were obtained by averaging individual RHI scans horizontally within 10 m vertical bins. |
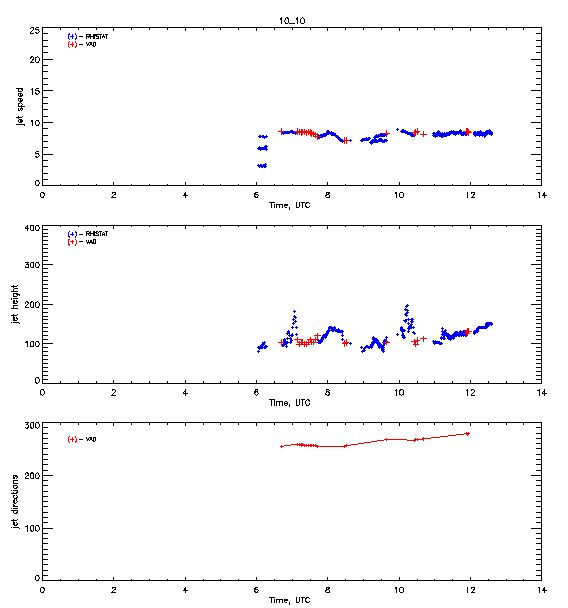 |
Time series (33 KB file) |
Time series plots of Low Level Jet (LLJ) characteristics. |
![]()