Estimating Air-Water Exchange of Nitric Acid
Valigura, R.A. 1995. An iterative bulk exchange model
for estimating air-water transfer of HNO3. J. Geophys.
Res. 100:26,045-26,050.
Background
Air-water exchange rates have been estimated for most
nitrogen species over open ocean, however, these rates
may not apply to coastal areas due to different meteorological
conditions. In coastal areas, the primary obstacle to estimating
the exchange rate has been the lack of near surface, over-water
meteorological data for mesoscale model input. In response
to this need, there has been an increased deployment of
measurement buoys along the east coast of the United States.
One such network of buoys is the
Chesapeake Bay Observing System (CBOS) owned and operated by the
University of Maryland's Horn Point Laboratory. The two objectives
of this project were to, i) develop and evaluate an iterative
bulk exchange model to estimate air-water exchange of heat,
water and momentum from buoy data, and ii) use the model
outputs to estimate air-water transfer rates of nitric
acid (HNO3). In a previous study, a similar approach to
that used in this study was applied to sulfur dioxide (SO2).
Because of a high affinity for water and relatively high
ambient concentrations in coastal areas, HNO3 is considered
to be the primary nitrogen species of interest for deposition
directly to water surfaces. Given its affinity for water,
HNO3 transfer can be considered uni-directional (i.e.,
downwards). Other than the use of bulk-water temperatures,
the parameterizations used here are essentially identical
to those used by Hicks and Liss [1976] and Wesely et al.
[1981]. Three days of mean meteorological data and eddy
correlation measurements of heat, moisture and momentum
fluxes were used to test the CBOS model. These data were
collected on tower, boat and airplane platforms from 16-20
June, 1990 near NOAA's Looe Key National Marine Sanctuary
in Florida [Crawford et al., 1993]. The mean data were
incorporated into the bulk exchange model and the resulting
output was compared, favorably, against the eddy correlation
data collected from the airplane [Crawford et al., 1993].
Experimental Set-Up
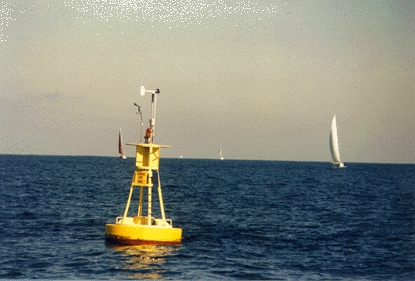
In late March 1992, the CBOS buoy was anchored in the
north Chesapeake Bay, off Howell Point, Maryland (39.36oN
76.1oW) for 3 periods between April 1992 and July 1994
(excluding the winter months) totaling 18 months. The buoy
is of the wave-follower variety, and allowed data to be
telemetered to a central computer system for remote access.
The cross section of the Bay narrows to 4.5 km in the area
of the buoy, making the fetch 4.5 km or greater in the
geographical window from 210o to 50o, and 1 km or less
in the window from 51o to 209o. Water depth is variable
across this section of Chesapeake Bay (average depth 5
m), but the buoy is anchored in the deep channel where
the depth of water is 12.5 m. The buoy was instrumented
to provide input data for the bulk-exchange model. The
instruments included: i) air temperature at 4 m above the
water, ii) water temperature at 0.75 m below the surface,
iii) wind speed at 4 m, and iv) relative humidity at 4
m.
Buoy Results and Discussion
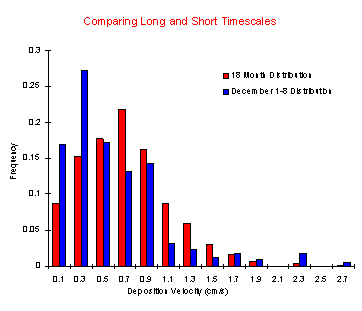
Deposition velocities were calculated for the approximately
25,000 10-minute periods that comprise the CBOS dataset
to date. The overall frequency distribution is presented
in Figure 1. When viewed on shorter time scales, the distribution
begins to change, as is shown for the first week in December
1993 (Figure 1). The potential danger of using average/general
deposition velocities in short term analysis becomes apparent
when the actual time series of Vd is reviewed for the same
week in December 1993, Figure 2. 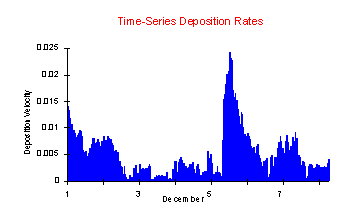 Meyers and Yuen [1987]
found that concurrent, high resolution Vd and concentration
data improved estimates of O3 deposition, but did not improve
estimates of SO2 deposition. The primary reason for the
difference between the two chemicals was that the measured
variability in O3 concentration was significantly correlated
with the corresponding measured variability in Vd (i.e,
concentrations were proportional to deposition rates),
and concentrations of SO2 were not correlated with corresponding
Vd (i.e., concentrations were not proportional to deposition
rate). It is unknown if HNO3 concentrations ([HNO3]) over
Chesapeake Bay are correlated with Vd ([HNO3] was not measured
during this study). To
illustrate the potential errors associated with using average
or time series Vd, a simple matrix analysis was performed
using the December 1993 time series, Table 1. Deposition
was estimated using three different Vd regimes (the actual
times series Vd, the time series average Vd, and the 1993
average Vd), and three different HNO3 concentrations representative
of [HNO3] commonly measured within the Bay region. The
concentrations were i) switched from a constant low (1.2
ppb) to a constant high (2.7 ppb) after the front, ii)
switched from a constant high to a constant low after the
front, and iii) maintained at the average (1.95 ppb). The
deposition estimate derived from using the time series
average Vd and average [HNO3] was used as the reference
value for intercomparisons, Table 1. Meyers and Yuen [1987]
found that concurrent, high resolution Vd and concentration
data improved estimates of O3 deposition, but did not improve
estimates of SO2 deposition. The primary reason for the
difference between the two chemicals was that the measured
variability in O3 concentration was significantly correlated
with the corresponding measured variability in Vd (i.e,
concentrations were proportional to deposition rates),
and concentrations of SO2 were not correlated with corresponding
Vd (i.e., concentrations were not proportional to deposition
rate). It is unknown if HNO3 concentrations ([HNO3]) over
Chesapeake Bay are correlated with Vd ([HNO3] was not measured
during this study). To
illustrate the potential errors associated with using average
or time series Vd, a simple matrix analysis was performed
using the December 1993 time series, Table 1. Deposition
was estimated using three different Vd regimes (the actual
times series Vd, the time series average Vd, and the 1993
average Vd), and three different HNO3 concentrations representative
of [HNO3] commonly measured within the Bay region. The
concentrations were i) switched from a constant low (1.2
ppb) to a constant high (2.7 ppb) after the front, ii)
switched from a constant high to a constant low after the
front, and iii) maintained at the average (1.95 ppb). The
deposition estimate derived from using the time series
average Vd and average [HNO3] was used as the reference
value for intercomparisons, Table 1.
Tabulated comparison between deposition (g HNO3 m-2)
estimates (Vd * [HNO3]) derived using different averaging
schemes and the time series average* estimate for the
first two weeks of December 1993 (percent differences
are shown in parenthesis).
                            Low-High          High-Low          Average
                         1.2 to 2.7 ppb    2.7 to 1.2 ppb      1.95 ppb
 Actual Time Series Vd     .85 (4.5)        .443 (-4.5)       .464 (0.0)
Time Series Average Vd    .429 (-7.5)        .499 (7.5)          .464*
      (.0049ms-1)
1993 Annual Average Vd     .567(22.0)       .661 (42.0)       .614 (32.0)
      (.0065ms-1)
The analysis shows that if Vd and [HNO3] are not correlated,
the error in deposition estimates is primarily driven by
errors in estimating mean values of Vd and [HNO3]. If they
are correlated, determining the source the associated errors
is more complex. If [HNO3] and Vd are correlated, adequate
estimation of deposition can only be obtained by concurrent
measurements of [HNO3] and Vd.
The Vd distribution (Figure 1) is likely to be conservative
for two reasons. The first and most important reason is
that the winter months are not accounted for because the
buoy is removed due to ice. Another reason to believe that
these estimates are conservative is that assuming equivalent
transfer rates for HNO3 and heat does not adequately account
for scavenging of HNO3 by aerosol water droplets and particles,
which tend to increase deposition rates. 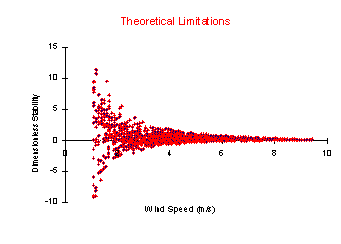 There
are theoretical limitations with this approach as well:
lack of homogeneous conditions in the coastal zone and
the inadequacy of similarity theory to describe turbulent
conditions measured. Because the northern Chesapeake Bay
is narrow, the local landscape tends to affect the meteorology
making fetch assumptions unreasonable, thereby making it
difficult to assume that the "local" buoy measurements
are representative of any sizeable area. The second theoretical
consideration concerns the Monin-Obukhov similarity theory
upon which the bulk transfer equations are based. This
theory has been evaluated, and is considered valid, over
a certain range (-1 z/L 1) of meteorological conditions.
During the two years of data collection, there were periods
where model outputs showed that conditions were too stable/unstable
to be considered in the "normal" Monin-Obukhov
frame. These periods were closely related to low wind speeds. There
are theoretical limitations with this approach as well:
lack of homogeneous conditions in the coastal zone and
the inadequacy of similarity theory to describe turbulent
conditions measured. Because the northern Chesapeake Bay
is narrow, the local landscape tends to affect the meteorology
making fetch assumptions unreasonable, thereby making it
difficult to assume that the "local" buoy measurements
are representative of any sizeable area. The second theoretical
consideration concerns the Monin-Obukhov similarity theory
upon which the bulk transfer equations are based. This
theory has been evaluated, and is considered valid, over
a certain range (-1 z/L 1) of meteorological conditions.
During the two years of data collection, there were periods
where model outputs showed that conditions were too stable/unstable
to be considered in the "normal" Monin-Obukhov
frame. These periods were closely related to low wind speeds.
The approach used in this study has been shown to be
applicable to SO2 and should be applicable to other hygroscopic
chemicals such as ammonia. To improve upon this technique,
further eddy correlation projects must be performed to
evaluate/modify the bulk transfer equation assumptions
under low wind conditions. In future investigations, concurrent
evaluation of HNO3 concentrations will allow for the quantification
of the actual differences between the time-series and the
single deposition velocity approaches.
Acknowledgments
This work was funded through the National Research Council
Assistantship Program, and was made possible by the Chesapeake
Bay Observing System buoy network owned and operated by
the University of Maryland Horn Point Environmental Laboratory.
References
Crawford, T.L., R.T. McMillan, T.P. Meyers and B.B. Hicks,
The spatial and temporal variability of heat, mass, and
momentum air-sea exchange in a coastal environment, J.
Geophys. Res., 98, 12869-12880, 1993.
Hicks, B.B. and P.S. Liss, Transfer of SO2 and other
reactive gases across the air-sea interface, Tellus, 28,
1976.
Meyers, T.P. and T.S. Yuen, An assessment of averaging
strategies associated with day/night sampling of dry-deposition
fluxes of SO2 and O3, J. Geophys. Res., 92,
6705-6712, 1987.
Wesely, M.L., Heat transfer through the thermal skin
of a cooling pond with waves, J. Geophys. Res., 84,
3696-3700, 1979. |

