Skip all navigation and jump to content Jump to site navigation Jump to section navigation.
NASA Logo - Goddard Space Flight Center + Visit NASA.gov
HOME PROJECTS RESOURCES SEARCH MAP

+ Advanced Search
Home
Home
View Most Recently Released Imagery
View Gallery of Imagery: A topical collection of SVS Imagery
Search Imagery by the keywords assigned to it
Search Imagery by the instruments that supplied data for a visualization product
Search Imagery by the series of visualizations that have been produced
Search Imagery by the scientist providing the data used in a visualization product
Search Imagery by the animator that created the product
Search Imagery by the identification number assigned to the visualization product
See other search options
Learn about the SVS Image Server
  + About the Server
  + Animation List
  + How to Use the Server


  + RSS Feeds
blank image

Table of Contents for Aqua

Aqua/AIRS
Aqua/AMSR-E
Aqua/MODIS
Aqua/CERES
Aqua

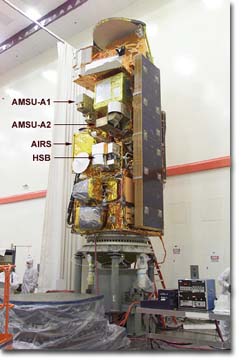
Atmospheric Infrared Sounder (AIRS) on Aqua
Image of Aqua-AIRS

For more information on the Atmospheric Infrared Sounder, click http://www-airs.jpl.nasa.gov/
Movie   ID   Title
Carbon monoxide near Greece (without date labels)   3449   Fires in Greece as seen by Aqua/AIRS
AIRS is providing the global background of carbon dioxide.  This animation shows the monthly averaged carbon dioxide and monthly averaged static wind vectors from July 2003.   3441   Aqua/AIRS Carbon Dioxide
This visualization shows global carbon dioxide from July 2003 at 8 km. Low concentrations are shown in blue and high concentrations are shown in red.   3440   Aqua/AIRS Global Carbon Dioxide
The A-Train observes Tropical Storm Debby   3437   The A-Train Observes Tropical Storm Debby
 Aqua-AIRS water vapor data (tight view, lower values faded out)   3129   Aqua/AIRS Water Vapor near southern California #2
Aqua-AIRS water vapor data (tight view, lower values faded out)   3128   Aqua/AIRS Water Vapor near southern California
 The color overlay represents the brightness temperature observed in one of the HSB channels. The most important color is blue, which indicates intense convection and likely rain cells. Green generally indicates thick clouds, while red indicates thin low clouds. (Microwave, unlike infrared, penetrates clouds and looks into them or even through them.)   2657   Super-Typhoon Pongsona Visualized from AIRS Instrument Suite Data
Volumetric global clouds on flat map (top view)   2418   AIRS Volumetric Cloud Data with Gradient Background (Fly Out)
Volumetric global clouds on flat map (top view)   2417   AIRS Volumetric Cloud Data with Gradient Background (Fly In)
Volumetric global temperature on flat map (top view)   2416   AIRS Volumetric Temperature Data with Gradient Background (Fly Out)
Volumetric global temperature on flat map (top view)   2415   AIRS Volumetric Temperature Data with Gradient Background (Fly In)
Volumetric global clouds on flat map (top view)   2414   AIRS Volumetric Cloud Data (Fly Out)
Volumetric global clouds on flat map (top view)   2413   AIRS Volumetric Cloud Data (Fly In)
Volumetric global temperature on flat map (top view)   2412   AIRS Volumetric Temperature Data (Fly Out)
Volumetric global temperature on flat map (top view)   2411   AIRS Volumetric Temperature Data (Fly In)

Advanced Microwave Scanning Radiometer for EOS (AMSR-E) on Aqua

For more information, please click http://wwwghcc.msfc.nasa.gov/AMSR/
Movie   ID   Title
The animation of Arctic sea ice from January 1 through September 12, with a two second hold on September 12, 2008. The date is displayed in the upper left corner.   3561   Close view of 2008 Arctic Sea Ice from AMSR-E
The animation of Arctic sea ice from January 1 through September 12, with a two second hold on September 12, 2008. The date is displayed in the upper left corner.   3556   2008 Arctic Sea Ice from AMSR-E
This animation shows the progression of warm waters slowly filling the Gulf of Mexico (shown in yellow, orange, and red). This natural annual warming contributes to the possible formation of hurricanes in the Gulf. SST data shown here ranges from January 1 to the present.   3532   Current Sea Surface Temperatures Rising in the Gulf of Mexico
This animation shows daily  surface temperature of the Greenland ice sheet  from May 1 through September 1, 2005.   An overlay contains  a date bar, a color bar and text labels.   3506   Surface Temperature of the Greenland Ice Sheet During the Summer of 2005
The 2008 maximum sea ice extent that occurred on March 9, 2008.   3498   AMSR-E Arctic Sea Ice Yearly Maximum from 2003 through 2008
Animation of sea ice motion around Antarctica during 2005 with a date overlay.   3497   AMSR-E Antarctic Sea Ice
Sea surface temperature in the Gulf of Mexico and the Atlantic on 2007-01-01.   3489   2007 Sea Surface Temperatures in the Gulf of Mexico
Sea surface temperature anomalies for the 2007 La Nina   3488   La Nina 2007 Sea Surface Temperature Anomalies
This animation shows the flow of the Jakobshavn glacier in 2000, followed by a time series of the glacier's retreat from 2001 through 2006. When pulling away from Greenland, a colored overlay shows the changes in the ice sheet elevation between 2003 and 2006.   3467   Updated Jakobshavn Glacier Calving Front Retreat from 2001 through 2006 with Blue/White Elevation Change over Greenland
This animation progresses at a rate of six frames per day from January 1, 2007 through the minimum extent which occurred on September 14, 2007. The false color of the sea ice highlights the fissures in blue and consolidated sea ice in white.   3466   2007 Arctic Sea Ice from AMSR-E with Greenland in Foreground
This image shows the minimum sea ice extent that occurred on September 14, 2007.   3456   2007 Arctic Sea Ice from AMSR-E with Alaska in Foreground
This animation shows the flow of the Jakobshavn glacier in 2000, followed by a time series of the glacier's retreat from 2001 through 2006. When pulling away from Greenland, a colored overlay shows the changes in the ice sheet elevation between 2003 and 2006.   3434   Updated Jakobshavn Glacier Calving Front Retreat from 2001 through 2006
This animation shows seasonal changes in landcover and Arctic sea ice from 2005-09-21 through 2006-09-20.   3404   Global Rotation showing Seasonal Landcover and Arctic Sea Ice
ICESat elevation data taken on June 2, 2006 is shown in orange. The underlying gray 'shadow' corresponds to where the elevation data lies on the surface.  The underlying MODIS data is a 3 day average taken in the month of December 2005.   3403   Antarctic Plumbing: Lake Englehardt's Subglacial Hydraulic System
This image shows a view of the Earth on September 21, 2005 with the full Arctic region visible.   3402   Global View of the Arctic and Antarctic on September 21, 2005
This animation starts from a global view and zooms into the Ayles Ice Shelf.  The region is identified by a red outline.  The shelf itself is identified by two flashes of solid red before the ice shelf breakup is shown. A date/time bar shows the progression of time.   3401   Ayles Ice Shelf Breakup in Arctic
Current SST data for the Gulf of Mexico and along the Atlantic coast.   3397   Current Sea Surface Temperatures Rising in the Gulf of Mexico
This animation shows AMSR-E sea surface temperature and MODIS seasonal landcover from the beginning of 2005 to December, 2006.   3390   AMSR-E Sea Surface Temperature
This animation shows snow cover, sea ice, clouds, sea surface temperature and biosphere while the view moves from North America across the Atlantic Ocean to Northern Africa and Europe.   3383   Sequence of Clouds, Snow Cover, Sea Ice, Sea Surface Temperature and Biosphere
This is the most recent Sea Surface Temperature (SST) data available for the Gulf of Mexico region and the Atlantic Coast region.  This data is used by scientists for studying hurricanes.  For more information please <a href='http://svs.gsfc.nasa.gov/vis/a000000/a003300/a003397/index.html'> click here.</a>   3376   Current Tropical Sea Surface Temperatures
This animation moves from a view of the Jakobshavn glacier in Greenland to a full global view, showing seasonal changes in Arctic sea ice and global snow cover. (slower version)   3373   Zoom from Jakobshavn Glacier with AMSR-E Daily Sea Ice and MODIS Daily Snow Cover
This animation shows the seasonal advance and retreat of sea ice over the Arctic from 8/5/2005 through 8/4/2006. The yearly cycle is repeated three times while the camera circles the Arctic, providing a view of the sea ice from a wide range of viewpoints.   3372   Loop of AMSR-E Daily Arctic Sea Ice from Aug 2005 to Aug 2006
This animation depicts the seasonal sea ice change in northern Canada by cycling twice through August 5, 2005 to August 5, 2006.
  3368   Annual Sea Ice Cycle over Northern Canada
NASA researchers studied several elements during Hurricane Katrina in 2005.
The top left window shows sea surface temperature and clouds.  The bottom left window shows wind analysis model data.   The top right window shows Rainfall Accumulation.  The bottom right window shows Hurricane Katrina's Hot Towers.   3362   NASA Scientists Research Tropical Cyclones
SST anomalies derived from NOAA-14/AVHRR SST data.  This data is a 10 day average spanning 2/1/99 to 2/10/99 which was collected during the 1998-1999 La Nina event.  An earlier animation of this La Nina event can be seen <a href='http://svs.gsfc.nasa.gov/vis/a000000/a003100/a003135/index.html'>here</a>.
  3358   Comparing the 1998-1999 La Nina event to the corresponding 2006 Sea Surface Temperature Anomaly Conditions
SST data for the Gulf of Mexico and along the Atlantic coast on October 31, 2006.   3357   2006 Sea Surface Temperatures Rising in the Gulf of Mexico
The short version of the Cryosphere Tour, with narration and music.   3355   A Short Tour of the Cryosphere
Full version with audio and annotations   3354   27 Storms: Arlene to Zeta
This animation shows the motion of the sea ice over the Arctic from 1/1/2005 through 12/31/2005.    3333   2005 Sea Ice over the Arctic derived from AMSR-E
The 2005 hurricane season showing sea surface temperatures, clouds, and named storm tracks.  Cloud data comes from GOES-12 and sea surface temperature comes from AMSR-E.   3306   2005 Hurricanes: Clouds and Sea Surface Temperature
Hurricane Wilma clouds and sea surface temperatures   3282   Hurricane Wilma -- SSTs and Clouds
The 2005 Hurricane season showing sea surface temperatures, clouds, and storm tracks   3279   Named Storms from the 2005 Atlantic Hurricane Season (Wide Shot)
Hurricane Rita clouds and sea surface temperatures on Sep 23, 2005 at 13:45GMT   3261   Hurricane Rita Sea Surface Temperature and Clouds
Sea surface temperature   3257   Sea Surface Temperature from June 1, 2005 to September 18, 2005
Anatomy of Hurricane Isabel when it was far out in the Atlantic   3252   Anatomy of Hurricane Isabel
GOES-12 infrared imagery over AMSR-E sea surface temperature for Hurricane Katrina, from August 23, 2005 to August 30, 2005.   3240   Hurricane Katrina Sea Surface Temperature (WMS)
Sea surface temperature on Aug 29, 2005   3225   Sea Surface Temperature from June 1, 2005 to August 29, 2005
Sea surface temperature showing Hurricane Katrina's cold water wake in blues (08-29-2005)   3222   Hurricane Katrina Sea Surface Temperature
This animation shows the Sea Surface Temperature Anomaly for the first part of 2005.   3192   Sea Surface Temperature Anomaly, 2005 (WMS)
This animation shows the sea surface temperature for the first part of 2005.   3191   Sea Surface Temperature, 2005 (WMS)
VIDEO WITH MUSIC AND CAPTIONS   3181   A Tour of the Cryosphere
This animation shows the daily sea ice 89 GHz brightness temperature over the northern hemisphere during the winter 2002-2003.   3168   Daily 89 MHz Brightness Temperature, 2002-2003 (WMS)
Sea surface temperature anomaly for 2004 Aug 5   3043   Indecisive El Nino Exhibits 'Split Personality'
This animation shows how the sea surface temperature can cause hurricanes to form.  Areas shown in orange and yellow are above 82 degrees F (27.8 degrees C) which is required for hurricanes to be able to form.  Sea surface temperatures below 82 degrees F are shown in blue.   2907   Hurricane Regions Indicated by Sea Surface Temperature from June 2002 to September 2003 (WMS)
The oceans in this animation have been falsely colored.  Temperatures warmer than normal are shown in red while cooler than normal temperatures are shown in blue.   2906   Global Sea Surface Temperature Anomalies from June, 2002 to September, 2003 (WMS)
The oceans of the world are falsely colored in this animation.  The warmest temperatures are shown in bright yellow and the coldest temperatures are shown in dark green and black.  Grey represents areas that have no data values such as coastal regions or land.  White represents surface ice.   2905   Global Sea Surface Temperature from June, 2002 to September, 2003 (WMS)
Hurricanes Fabian and Isabel leave cold water trails in their wake.   2897   Cold Water Trails from Hurricanes Fabian and Isabel (WMS)
As the hurricanes move through the ocean, they each leave a wake of cold water.  This visualization shows the cold water trails left by Hurricanes Fabian and Isabel.  The red/orange/blue colors represent the ocean temperatures (orange/red is 82 degrees F and higher).   2824   Cold Water Trails from Hurricanes Fabian and Isabel
This visualization shows sea surface temperature as measured by the NASA Aqua satellite's Advanced Microwave Scanning Radiometer (AMSR-E) instrument. Temperature is represented by the colors in the ocean.  Orange and red indicate the necessary 82-degree and warmer sea surface temperatures for a hurricane to form.   2817   Recipe of a Hurricane (Part 1) - Sea Surface Temperature
3-30-03 AMSR-E data showing showing mostly cool waters off the African coast.   2816   Recipe of a Hurricane (Part 1) - Sea Surface Temperature (match rendered)
This animation show a year in the life of global ocean temperatures, June 2, 2002 to May 11, 2003. Blue indicates the colder-than-normal anomalous water.  Red shows warmer-than-normal anomalous water.   2760   AMSR-E Anomalous Pacific Sea Surface Temperature Data Used to predict 2003 Hurricane Season
This animation show a year in the life of global ocean temperatures, June 2, 2002 to May 11, 2003. Blue indicates the cooler-than-normal water. Red shows  warmer-than-normal water.   2759   AMSR-E Anomalous Pacific Sea Surface Temperature Data Used to predict 2003 Hurricane Season
This animation places the AMSR-E Sea Surface Temperature anomaly data on a sphere and sequences from June 2, 2002 to May 11, 2003.   2758   AMSR-E Anomalous Atlantic Sea Surface Temperature Data Used to Forecast 2003 Hurricane Season
This animation show a year in the life of global ocean temperatures, June 2, 2002 to May 11, 2003. Blue indicates the coolest water, Red the warmest.   2757   AMSR-E Anomalous Atlantic Sea Surface Temperature Data Used to Forecast 2003 Hurricane Season
This animation show a year in the life of global ocean temperatures, June 2, 2002 to May 11, 2003. Green indicates the coolest water, yellow the warmest.   2756   AMSR-E Global Anomalous Sea Surface Temperature Data Used to Forecast 2003 Hurricane Season
This animation show a year in the life of global ocean temperatures, June 2, 2002 to May 11, 2003. Green indicates the coolest water, yellow the warmest.   2755   AMSR-E Pacific Sea Surface Temperature Data Used to Forecast 2003 Hurricane Season
This animation show a year in the life of global ocean temperatures, June 2, 2002 to May 11, 2003. Green indicates the coolest water temperatures. Yellow shows the warmest temperature.   2754   AMSR-E Atlantic Sea Surface Temperature Data Used to Forecast 2003 Hurricane Season
This animation show a year in the life of global ocean temperatures, June 2, 2002 to May 11, 2003. Green indicates the coolest water, yellow the warmest.   2753   AMSR_E Pacific Sea Surface Temperature Data Used to Forecast 2003 Hurricane Season
This animation show a year in the life of global ocean temperatures, June 2, 2002 to May 11, 2003. Green indicates the coolest water, yellow the warmest.   2752   AMSR-E Sea Surface Temperature in the Atlantic Used to Forecast 2003 Hurricane Season
This animation show a year in the life of global ocean temperatures, June 2, 2002 to May 11, 2003. Green indicates the coolest water, yellow the warmest. The Advanced Microwave Scanning Radiometer (AMSR-E) on the Aqua satellite saw through the clouds to provide sea surface temperatures.   2751   AMSR-E SST Global Flat Map: Sea Surface Temperature Data Used to Forecast 2003 Hurricane Season
SST Anomalies and SS Wind Anomalies in the Pacific.   2696   SST Anomalies + Wind Anomalies (with dates)
SST Anomalies and SS Wind Anomalies from 21 Jan 2003 (with gray arrows)   2695   SST Anomalies + Wind Anomalies
SST Anomalies   2692   Sea Surface Temperature Anomalies (with dates)
SST Anomalies from 01 Jan 2003   2691   Sea Surface Temperature Anomalies
all the channels are in microwave spectrum,   2471   Aqua First Light: AMSR-E Pseudo Color Global
This is a cloudless image of Sea Surface Temperature   2470   Aqua First Light: AMSR-E Sea Surface Temperature Global
A closer look at Asia   2469   Aqua First Light: AMSR-E Pseudo Color on a Flat Map
A closer look of Asia   2468   Aqua First Light: AMSR-E Sea Surface Temperature on a Flat Map

Aqua-MODIS
Image of Aqua-MODIS
Movie   ID   Title
This animation shows the progression of warm waters slowly filling the Gulf of Mexico (shown in yellow, orange, and red). This natural annual warming contributes to the possible formation of hurricanes in the Gulf. SST data shown here ranges from January 1 to the present.   3532   Current Sea Surface Temperatures Rising in the Gulf of Mexico
Fade from month to month over the seasonal  landcover data.   3523   Seasonal Landcover for Science-on-a-Sphere
This animation shows a 32-day moving average of SST data around the world and around Australia.  This data continuously loops from July 4, 2002 to October 23, 2006.   3510   MODIS Sea Surface Temperature from 2002 to 2006 around Australia
The A-Train observes Tropical Storm Debby   3437   The A-Train Observes Tropical Storm Debby
Both CloudSat and CALIPSO detect attributes of clouds on slices through the atmosphere.  Here both are shown over an image of MODIS reflectance which is mapped onto the terrain.   3436   CloudSat, Calipso and MODIS over Central America
Animation zooms to view the ice shelf as seen from the northwest coastline and sequences through the satellite images showing the ice shelf breakup. An  overlay shows the date and time, the region of interest and the area of the ice shelf broken.   3430   Ayles Ice Shelf Breakup Viewed from Northwest Coastline
Animation zooms to view the ice shelf from overhead and sequences through the satellite images showing the breakup.  The overlay shows the region of interest and the date and time.   3429   Ayles Ice Shelf Breakup Viewed from Overhead
An animation of the NAMMA mission aircraft flights out of Sal, Cape Verde with satellite flight tracks indicated.   3419   NAMMA Aircraft Flights from Cape Verde
High resolution LIMA data (15 meters per pixel) of the area where Ross Island meets the Ross Ice Shelf.   3418   Sample LIMA Data versus MOA Data of Ross Island
High resolution LIMA data (15 meters per pixel) of the area immediately surrounding McMurdo Station.  If you look really close in the foreground, McMurdo Station can be seen as a few white dots on the open rocky outcrop of Ross Island's peninsula.  The straight lines in the lower left corner of the picture are runways.   3417   Sample LIMA Data versus MOA Data of McMurdo Station
High resolution LIMA data (15 meters per pixel) of the area surround McMurdo Station.   3416   Sample LIMA Data versus MOA Data of the Area Surrounding McMurdo Station
High resolution LIMA data (15 meters per pixel) centered over Koettlitz Glacier.   3415   Sample LIMA Data versus MOA Data of Koettlitz Glacier
High resolution LIMA data (15 meters per pixel) centered over Ferrar Glacier.   3414   Sample LIMA Data versus MOA Data of Ferrar Glacier
ICESat elevation data taken on June 2, 2006 is shown in orange. The underlying gray 'shadow' corresponds to where the elevation data lies on the surface.  The underlying MODIS data is a 3 day average taken in the month of December 2005.   3403   Antarctic Plumbing: Lake Englehardt's Subglacial Hydraulic System
This animation shows a 32-day moving average of SST data spanning July 4, 2002 to October 23, 2006.  The animation starts over Europe, pans across the Atlantic, and settles in over the Gulf Stream.   3389   MODIS Sea Surface Temperature Highlighting the Gulf Stream (2002 to 2006)
This animation shows a 32-day moving average of SST data over the Pacific spanning July 4, 2002 to October 23, 2006.   3388   MODIS Sea Surface Temperature from 2002 to 2006
The short version of the Cryosphere Tour, with narration and music.   3355   A Short Tour of the Cryosphere
MODIS snow cover and sea ice surface temperature in the Northern Hemisphere from September 1, 2002 through May 31, 2003.   3353   Terra/Aqua MODIS: Snow Cover and Sea Ice Surface Temperature
This animation cycles through 4 years of Sea Surface Temperature data to show the seasonal variablility.  The Sea Surface Temperature around Australia warms from November through April.   3351   MODIS Sea Surface Temperature around the Australian Continent
This animation is created from MODIS data of Sea Surface Temperature that is composited across a 32 day period.  This still image is of January 25, 2006 through February 25, 2006.   3350   MODIS Sea Surface Temperature Time Series Data Shows Increased Temperatures in Great Barrier Reef - Wide View
This animation shows the Aqua satellite orbiting the Earth on August 27, 2005 by revealing MODIS true-color imagery for that day.  This animation is on a cartesian map projection, so the satellite will look accurate only when the animation is wrapped on a sphere.   3348   Aqua Satellite and MODIS Swath
 This animation shows the temperature of the sea ice surface in the Arctic during 2002-2003.   3345   Sea Ice Surface Temperature with Alternate Color Scale (WMS)
MODIS image for the southern Great Barrier Reef showing chlorophyll concentration showing oceanographic patterns.   3344   Chlorophyll Concentration Shows Oceanographic Patterns in Great Barrier Reef
Sea Surface Temperature of the Southern Great Barrier Reef shows increased temperatures at the most severe coral bleaching sites.   3343   MODIS Sea Surface Temperature Data Shows Increased Temperatures in Southern Great Barrier Reef
This image was taken by Space Imaging's IKONOS satellite which has a resolution of 4 meters per pixel.  The image shows coral bleaching around Herron Island in Australia's Great Barrier Reef.   3342   IKONOS and Aqua MODIS Imagery of Southern Great Barrier Reef
Final animation composite showing both land-based photographs of seasonal vegetation change alongside satellite data of NDVI over the United States.  The animation first starts with photographs of Tamarisk at the Grand Staircase Escalante National Monument in Utah.  These photos then cycle through time showing the changing seasons.  They then pull away to reveal NDVI data over the western U.S.  The NDVI data continues to cycle through the seasons in synchronization with the photos.  Finally, the cycling NDVI data is combined with land cover classification data to create the Tamarisk suitability map.   3332   Deriving the Tamarisk Suitability Map: The Complete Story
NDVI (in shades of green) is the topmost dataset.  EVI (in shades of red, orange, and brown) is the middle layer.  Landcover (in shades of yellow, orange, and green) is the bottommost layer.   3331   Creating the Tamarisk Habitat Suitability Map (for Science Presentations)
The Annual Vegetation Cycle data (in shades of green) is the topmost dataset in this image.  The MODIS Landcover Classification data (in shades of yellow, orange, and green) is the bottommost dataset in this image.   3330   Creating the Tamarisk Habitat Suitability Map (for General Use)
Four days of Aqua MODIS ocean color swaths during the period of Hurricane Katrina, from August 27, 2005 through August 30, 2005.   3328   Aqua MODIS Ocean Color Swath during Hurricane Katrina
Four days of accumulating Aqua MODIS ocean color swaths during the period of Hurricane Katrina, from August 27, 2005 through August 30, 2005.   3327   Aqua MODIS Ocean Color Progression during Hurricane Katrina
Four days of Aqua MODIS ocean color granules during the period of Hurricane Katrina, from August 27, 2005 through August 30, 2005.   3326   Aqua MODIS Ocean Color Granules during Hurricane Katrina
Four days of Aqua MODIS sea surface temperature swaths during the period of Hurricane Katrina, from August 27, 2005 through August 30, 2005.   3325   MODIS Sea Surface Temperature Swath during Hurricane Katrina
Four days of accumulating Aqua MODIS sea surface temperature swaths during the period of Hurricane Katrina, from August 27, 2005 through August 30, 2005.   3324   Aqua MODIS Sea Surface Temperature Progression during Hurricane Katrina
Four days of Aqua MODIS sea surface temperature granules during the period of Hurricane Katrina, from August 27, 2005 through August 30, 2005.   3323   Aqua MODIS Sea Surface Temperature Granules during Hurricane Katrina
Four days of Aqua MODIS true-color swaths during the period of Hurricane Katrina, from August 27, 2005 through August 30, 2005.   3322   MODIS True Color Swaths during Hurricane Katrina
Four days of accumulating Aqua MODIS true-color swaths during the period of Hurricane Katrina, from August 27, 2005 through August 30, 2005.   3321   Aqua MODIS True Color Progression during Hurricane Katrina
Four days of Aqua MODIS true-color granules during the period of Hurricane Katrina, from August 27, 2005 through August 30, 2005.   3320   Aqua MODIS True Color Granules during Hurricane Katrina
This animation is match framed to animation ID 3295.  It shows the crevasses and ice floes in the Ross Ice Shelf without using the ICESat topography.   3319   MODIS Mosaic of Antarctica sees the Ross Ice Shelf without ICESat Topography
This animation flys over the Thwaites Glacier exposing the line of grounded icebergs and into Pine Island Bay to view the Pine Island Glacier.  This animation does not use ICESat topography, but it is match-framed to animation ID 3294 which does have topography.
  3318   MODIS Mosaic of Antarctica view of Pine Island and Thwaites Glacier without ICESat Topography
With the B-15A iceberg gone, the sea ice is now free to circulate in the McMurdo Sound. These animations have dates.   3305   McMurdo Sound Flows Easy
This animation follows Hurricane Wilma as it progresses through the Gulf of Mexico and hits Florida.   3302   Hurricane Wilma MODIS Progression
Tamarisk habitat suitability for the state of Colorado.   3300   Habitat Suitability for Tamarisk Invasion in the State of Colorado
Tamarisk habitat suitability for the state of California.   3299   Habitat Suitability for Tamarisk Invasion in the State of California
Tamarisk habitat suitability for the state of Nevada   3298   Habitat Suitability for Tamarisk Invasion in the State of Nevada
Tamarisk habitat suitability for the state of Arizona.   3297   Habitat Suitability for Tamarisk Invasion in the State of Arizona
Tamarisk habitat suitability for the state of Utah as of August 2005.   3296   Habitat Suitability for Tamarisk Invasion in the State of Utah
The MODIS Mosaic of Antarctica reveals the dynamic crevasses and ice flows in the Ross Ice Shelf.   3295   MODIS Mosaic of Antarctica sees the Ross Ice Shelf
Tamarisk habitat suitability for the state of New Mexico as of August 2005.   3293   The Habitat Suitability for Tamarisk Invasion in the State of New Mexico
This is the tamarisk habitat suitability map for Texas. It was produced in August 2005.   3292   Habitat Suitability for Tamarisk Invasion in the State of Texas
National map produced in August 2005 showing habitat suitability for tamarisk invasion.
The states that have the most suitable habitat for Tamarisk are highlighted.   3291   National Map Showing Habitat Suitability for Tamarisk Invasion
Hurricane Rita threatening the Texas and Louisiana coasts on 9/23/05.   3265   Hurricane Rita MODIS Progression
Imagery of Hurricane Katrina from August 23, 2005 to August 30, 2005 from the MODIS Instrument on the Aqua satellite.  Gaps in the MODIS imagery have been filled in with visible imagery from GOES-12.   3255   Aqua MODIS Imagery of Hurricane Katrina (WMS)
Hurricane Ophelia, viewed with Terra and Aqua satellites   3246   Hurricane Ophelia
Images of Hurricane Katrina aquired by the MODIS instruments on Terra and Aqua from August 24 to August 31, 2005. To get the individual images, follow the 'Sequence' link below. To get the geographical registration information, follow the 'DEPC metadata' link near the bottom of the page.   3238   Progression of Hurricane Katrina, 2005 (WMS)
Hurricane Katrina slams into Louisiana and Mississippi.   3224   Hurricane Katrina Progression
This is a composite image of all of the available individual images together.   3200   Progression of Hurricane Emily, 2005 (WMS)
July 10, 2005 16:15 (UTC) In this image, with winds of 217 kilometers per hour (135 mph), Hurricane Dennis was a powerful Category 4 storm just hours away from making landfall.  The eye of the storm was about 90 kilometers (55 miles) south, southeast of Pensacola, Florida, and the storm was moving northwest at about 29 kilometers per hour (18 mph).   3196   Hurricane Dennis
The Cave Creek Complex Fire on 6/23/05.   3195   The Cave Creek Complex Fire near Phoenix, Arizona
This image shows a composite of the individual images available.   3194   Progression of Hurricane Dennis, 2005 (WMS)
VIDEO WITH MUSIC AND CAPTIONS   3181   A Tour of the Cryosphere
This image shows the snow cover and sea ice surface temperature on March 15, 2003.   3180   MODIS Daily Global Snow Cover and Sea Ice Surface Temperature as seen in the SIGGRAPH 2005 Electronic Theater
Hurricane Fabian, 2003-09-03 15:05 UTC   3158   Progression of Hurricane Fabian, 2003 (WMS)
Image Sequence for Hurricane Charley.   3153   Progression of Hurricane Charley, 2004 (WMS)
Hurricane Ivan, Sep 16 2004 16:23 UTC   3151   Progression of Hurricane Ivan, 2004 (WMS)
Hurricane Frances on 2004 Sep 04 16:00 UTC.   3147   Progression of Hurricane Frances, 2004 (WMS)
 Hurricane Isabel images from Sep 18 15:55 UTC, Sep 17 15:09 UTC, Sep 16 17:40 UTC, Sep 15 15:30 UTC, Sep 14 17:55 UTC, Sep 12 15:00 UTC, Sep 11 14:15 UTC, Sep 10 16:40 UTC, and Sep 08 13:45 UTC.   3139   Hurricane Isabel 2003 Progression Images
This animation shows iceberg B-15A drifting in McMurdo Sound.   3081   Giant Iceberg in McMurdo Sound (WMS)
This animation shows the temperature of the sea ice surface near the north pole in 2002-2003.  The region is covered by darkness when no measurements were taken.   3037   Sea Ice Surface Temperature with Regions of No Data Indicated (WMS)
This animation shows the temperature of the sea ice near the north pole in 2002-2003.   3036   Daily Sea Ice Surface Temperature 2002-2003 (WMS)
Image Sequence of Hurricane Jeanne.   3035   Progression of Hurricane Jeanne, 2004 (WMS)
Hurricane Jeanne, September 22, 2004, Terra Satellite   3021   Hurricane Jeanne Crashes into Florida
Hurricane Jeanne, September 22, 2004, Terra Satellite   3019   Hurricane Jeanne's Progression with a Fixed View
Hurricane Jeanne, September 22, 2004, Terra Satellite   3018   A Fixed View of Hurricane Jeanne's Progression
Hurricane Ivan, September 9, 2004, Terra Satellite   3015   A Fixed View of Hurricane Ivan
Hurricane Ivan on September 14, 2004   3007   Hurricane Ivan Progression as Seen by MODIS September 9-14, 2004
Hurricane Ivan, September 9, 2004, Aqua Satellite   3006   Hurricane Ivan Progression with Fixed View
Hurricane Ivan, September 9, 2004, Aqua Satellite   3005   Hurricane Ivan Progression
Hurricane Ivan, September 9, 2004, Aqua Satellite   3003   Hurricane Ivan Heads Towards Jamaica
 Air quality from EPA and MODIS on 1 September 2003   2999   MODIS Data May Aid EPA Air Quality Predictions (Tight)
Air quality from EPA and MODIS on 1 September 2003   2998   MODIS Data May Aid EPA Air Quality Predictions (Wide)
 Hurricane Frances, August 27, 2004, Aqua Satellite   2994   Flying Along with Hurricane Frances
Hurricane Ivan, September 5, 2004, Aqua Satellite   2993   Up on Deck, Hurricane Ivan
Hurricane Frances, August 27, 2004, Aqua Satellite   2992   Hurricane Frances Progression with a Fixed View
This image shows the snow cover and sea ice surface
temperature over Europe on March 12, 2003   2985   Daily Snow and Sea Ice Temperature over Asia
This image shows the snow cover and sea ice surface
temperature over Europe on February 7, 2003.   2984   Daily Snow and Sea Ice Temperature over Europe
This image shows the snow cover and sea ice surface
temperature over North America on February 9, 2003.   2983   Daily Snow and Sea Ice Temperature over North America
This image shows the snow cover and sea ice surface temperature over the North Pole on March 23, 2003.   2982   Daily Snow and Sea Ice Temperature over the North Pole
This animation shows the daily advance and retreat of snow cover, and sea ice surface temperature over the Northern Hemisphere during the
winter of 2002-2003.  Snow cover over the tip of South America is also shown during the summer of 2000.   2981   Global Daily Snow and Sea Ice Surface Temperature
NOAA oxygen water data along the Gulf Coast   2979   Mississippi Dead Zone
Hurricane Frances, August 27, 2004, Aqua Satelite   2977   Hurricane Frances Progression with Fixed View
Hurricane Frances, August 27, 2004, Aqua Satellite   2974   Hurricane Frances Progression
Smoke plumes from the eastern Alaska fires on June 29, 2004.   2972   Fires Ravage Parts of Alaska and Canada
 A closer view of the fires. Date 2004-06-29   2965   Fires and Smoke Across Alaska and Canada
On May 16, 2004 Nida engulfs the Philippines.   2951   Super Typhoon Nida
Hurricane Isabel Frame Sequence.   2919   Progression of Hurricane Isabel, 2003 (WMS)
This animation shows the MODIS imagery of the California fires from October 23, 2003 to October 29, 2003.  Then it zooms out and reruns the sequence with the TOMS aerosol data overlaid on top of the MODIS imagery.   2858   California Fires MODIS imagery and TOMS Aerosols from October 2003
Fire image from October 23, 2003   2852   2003 California Fire Sequence as Seen by MODIS
This image shows San Diego, California on October 27, 2003.  Red fire pixels have been laid on top of the Aqua-MODIS image to show the
start of each incident fire.   2845   Southern California Fires, October 27, 2003 (Fire Pixels Included)
San Diego, California continues to battle tremendous fire and smoke on October 27, 2003   2844   Southern California Fires, October 27, 2003
Animation zooms down to B-15A on October 9th, 2003.  The crack can clearly be seen in the center of the final frame.   2841   Iceberg B-15A: October 9, 2003
Animation zooms down to Iceberg B-15A on October 7th, 2003.  The beginnings of the crack can be seen in the center of the final frame.   2840   Iceberg B-15A: October 7, 2003
B-15A on October 9th, 2003.  In this image, the crack is easily visible, appearing in the center of the image.   2838   Iceberg B-15A: Sample Composite
This visualization shows the progrssion of Hurricane Isabel across the Atlantic as seen by the MODIS instruments on NASA's Terra and Aqua spacecraft.   2825   Hurricane Isabel Progresssion as Seen by MODIS
Washington Fires on 21 July 2003   2815   Washington Fires with Red Fire Pixels
Washington fires from 19 July 2003 with yellow fire pixels   2814   Fires in Washington (with yellow fire pixels)
Washington fires on 19 July 2003   2813   Washington Fires
This visualization was a quick-turnaround showing Hurricane Claudette using Aqua/MODIS data from 20 June 2003.   2808   Hurricane Claudette from Aqua/MODIS
This visualization was a quick-turn around showing two fires in Arizona using Aqua/MODIS data from 20 September 2003.   2807   Arizona Fires from Aqua/MODIS
Hurricane Isabel closing in on the U.S.   2803   Hurricane Isabel north of Puerto Rico, September 14, 2003
Hurricane Isabel closing in on the U.S.   2802   Close-up view of Hurricane Isabel, September 14, 2003
Close-up of Hurricane Isabel on September 10, 2003.   2800   Tracking the Category 4 Hurricane Isabel, September 10, 2003
Aqua-MODIS dataset August 6, 2003   2792   Typhoon Etau
Close-up view with fire pixels   2789   Washington Fawn Peak Complex Fire - July 29, 2003
Close-up view with fire pixels   2788   Montana and Alberta (Canada) fires - July 29, 2003
Close-Up view with smoke plumes and fire pixels.   2787   Fires in the Northwest (Fire Pixels) - July 28, 2003
Close-up view of the smoke plumes.   2786   Fires in the Northwest - July 28, 2003
A still of the GPM animation.   2782   GPM Earth Spin Animation
Lake Nasser, Egypt   2781   GPM Nile River Animation
June 19, 2003   2776   Aspen Fire, Arizona
This image shows the Aspen, Arizona fire on June 24, 2002.  Roads and population centers are shown in grey.   2775   Zoom to the Aspen Fire, Arizona on June 24, 2003
 This image shows the Aspen, Arizona fire on June 24, 2003.  The view is centered on the fire.   2774   A Time Series of the Aspen Fire North of Tucson, Arizona from June 19 - 24, 2003
This image shows the Aspen, Arizona fire on June 20, 2003   2773   A Time Series of the Aspen, Arizona Fire from June 19 - 24, 2003 (offset view)
This animation shows a zoom into the Aspen, Arizona fire
on June 19, 2003.  Major roads are shown in grey.   2772   Zoom to the Aspen Fire, Arizona on June 19, 2003
A view of the Great Lakes on March 9, 2003.  Note how Lakes Superior, Huron, Erie, and Ontario are completely frozen over.    2740   Ice Covers the Great Lakes
This animation starts with a global view of the world, zooms into the storm area, and dissolves between each the images taken every day.   2706   African Dust Sequence
Terra-MODIS snow image on February 20, 2003   2705   Terra/Aqua Snow Sequence January/February 2003
Fires and smoke close up   2679   Fires and Smoke in Southeast Australia, January 23, 2003
This image shows  streamers of dust blowing southwestward over the Los Angeles metropolitan area.   2660   Santa Ana winds on January 6, 2003
Close up of Lakes Michigan, Huron, Erie, and Ontario.   2653   Great Lakes Snow Effect 2002
On August 12, 2002, the Moderate Resolution Imaging Spectroradiometer (MODIS) on NASAs Aqua satellite captured this image, showing the smoke from the burning fires.   2506   Smoke from Oregon Fires
This image show the heavy smoke moving along the east coast and into the Atlantic.   2505   Smoke from Canadian Wildfires
Typhoon Chataan off the coast of Japan.   2502   Super Typhoon Chataan
This image depicts the overflooding of the Texas rivers.   2500   Flooding in Southeast Texas
This image shows two of the images (the U.S. East Coast covered in smoke and flooding in Texas) that were captured by MODIS.   2499   The First Day In The Life of Aqua/MODIS
This is the standard definition version of the Senor Web: Smart Satellites animation MPEG.   10001   Sensor Web: Smart Satellites

CERES (Clouds and Earth's Radiant Energy System) on Aqua
Image of Aqua-CERES

The CERES instrument aboard many Earth-orbiting satellites records the flow of reflected Solar radiation and reprocessed longwave radiation in the Earth's radiation budget.
Movie   ID   Title
This animation shows 29 orbits (2 days) of CERES measurements of regions of solar reflectivity, from June 20-21, 2003.  The measurements are superimposed over a global infrared cloud cover composite from the same period.   3179   Scene Identification Compared to Clouds (WMS)
This animation shows net radiation flux corresponding to 29 orbits (2 days) of CERES measurements, from June 20-21, 2003. This data is calculated from CERES outgoing longwave and shortwave measurements, along with a corresponding calculated incoming solar flux.  The measurements are superimposed over a global infrared cloud cover composite from the same period.    3177   Net Radiation Flux Compared to Clouds (WMS)
This animation shows 29 orbits (2 days) of outgoing longwave radiation, form June 20-21, 2003.  The measurements are superimposed over a global infrared cloud cover composite from the same period.   3176   Outgoing Longwave Flux Compared to Clouds (WMS)
This animation shows 29 orbits (2 days) of CERES measurements of outgoing shortwave radiation, from June 20-21, 2003.  The measurements are superimposed over a global infrared cloud cover composite from the same period.   3175   Outgoing Shortwave Flux Compared to Clouds (WMS)
This animation shows 29 orbits (2 days) of CERES
measurements of outgoing shortwave radiation, from June 20-21, 2003.   3108   Instantaneous Outgoing Shortwave Flux (WMS)
This animation shows 29 orbits (2 days) of CERES
measurements of outgoing longwave radiation, from June 20-21, 2003.   3107   Instantaneous Outgoing Longwave Flux (WMS)
This animation shows net radiation flux corresponding
to 29 orbits (2 days) of CERES measurements, from June 20-21, 2003.  This data
is calculated from CERES outgoing longwave and shortwave measurements, along
with a corresponding calculated incoming solar flux.   3106   Instantaneous Net Radiation Flux (WMS)
This animation shows 29 orbits (2 days) of CERES
measurements of regions of solar reflectivity, from June 20-21, 2003.   3104   Instantaneous Scene Identification (WMS)
This animation shows the monthly average total-sky outgoing
shortwave flux from CERES for July 2002 through June 2004.   3097   Average Total-sky Outgoing Shortwave Flux (WMS)
This animation shows the monthly average clear-sky outgoing
shortwave flux from CERES for July 2002 through June 2004.   3096   Average Clear-sky Outgoing Shortwave Flux (WMS)
This animation shows the monthly average total-sky incoming solar flux
from CERES for July 2002 through June 2004.   3095   Average Total-sky Incoming Solar Flux (WMS)
This animation shows the monthly average total-sky net
radiant flux from CERES for July 2002 through June 2004.   3094   Average Total-sky Net Radiant Flux (WMS)
This animation shows the monthly average clear-sky net
radiant flux from CERES for July 2002 through June 2004.   3093   Average Clear-sky Net Radiant Flux (WMS)
This animation shows the monthly average total-sky outgoing
longwave flux from CERES for July 2002 through June 2004.   3092   Average Total-sky Outgoing Longwave Flux (WMS)
This animation shows the monthly average clear-sky outgoing
longwave flux from CERES for July 2002 through June 2004.   3091   Average Clear-sky Outgoing Longwave Flux (WMS)
This animation shows the monthly average total-sky albedo
from CERES for July 2002 through June 2004.   3090   Average Total-sky Albedo (WMS)
This animation shows the monthly average clear-sky albedo
from CERES for July 2002 through June 2004.   3089   Average Clear-sky Albedo (WMS)

Aqua
Movie   ID   Title
This is the standard definition version of the Water Vapor animation MPEG.   10017   Aqua Mission Science Objectives
This is the standard definition version of the Water Cycle animation MPEG.   10016   Aqua Mission Science Objectives


Back to Top

USA.gov logo - the U.S. Government's official Web portal. + Privacy Policy and Important Notices
+ Reproduction Guidelines
NASA NASA Official:
SVS Contact:
Curator: