Hurricane Gustav on August 27, 2008
|
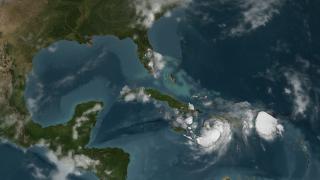
NASA's TRMM spacecraft observed this view of Hurricane Gustav on August 27, 2008 as it attacked Haiti. At this time the storm was a category 1 hurricane with sustained winds of 65 knots (75 mph) and a pressure reading of 992 millibars. The cloud cover is taken by TRMM's Visible and Infrared Scanner(VIRS) and the GOES spacecraft. The rain structure is taken by TRMM's Tropical Microwave Imager (TMI) and TRMM's Precitation Radar(PR) instruments. TRMM looks underneath of the storm's clouds to reveal the underlying rain structure. Blue represents areas with at least 0.25 inches of rain per hour. Green shows at least 0.5 inches of rain per hour. Yellow is at least 1.0 inches of rain and red is at least 2.0 inches of rain per hour.
|
|
|
|
Hurricane Gustav weakened as it stalled over Haiti. The storm has already killed 22 people in Haiti and the Dominican Republic.
Duration: 28.0 seconds
Available formats:
3840x2160
TIFF
8 MB
1280x720 (60 fps)
Frames
320x180
PNG
288 KB
160x80
PNG
66 KB
80x40
PNG
17 KB
1280x720 (29.97 fps)
MPEG-4
30 MB
512x288 (30 fps)
MPEG-1
4 MB
1280x720 (30 fps)
Frames
How to play our movies
|
|
|
|
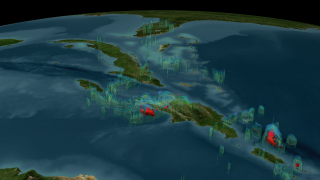
If we remove the clouds, we can see Gustav's rain structure. Rain is the fuel that drives these storms. The blue region represents areas where the storm is dumping at least 0.25 inches of rain per hour. Green is 0.5 inches of rain per hour, yellow is 1.0 inches of rain and red is 2.0 inches of rain per hour.
Available formats:
3840 x 2160
TIFF
6 MB
320 x 180
PNG
248 KB
|
|
|
Back to Top
|

