Skip all navigation and jump to content Jump to site navigation Jump to section navigation.
NASA Logo - Goddard Space Flight Center + Visit NASA.gov
HOME PROJECTS RESOURCES SEARCH MAP

+ Advanced Search
Home
Home
View Most Recently Released Imagery
View Gallery of Imagery: A topical collection of SVS Imagery
Search Imagery by the keywords assigned to it
Search Imagery by the instruments that supplied data for a visualization product
Search Imagery by the series of visualizations that have been produced
Search Imagery by the scientist providing the data used in a visualization product
Search Imagery by the animator that created the product
Search Imagery by the identification number assigned to the visualization product
See other search options
Learn about the SVS Image Server
  + About the Server
  + Animation List
  + How to Use the Server


  + RSS Feeds
blank image
Previous Animation
Next Animation
Biosphere Data Over Northeastern United States

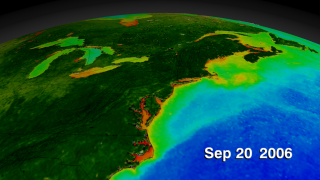
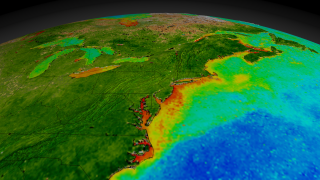
The SeaWiFS instrument aboard the SeaStar satellite has been collecting ocean data since 1997. By monitoring the color of reflected light via satellite, scientists can determine how successfully plant life is photosynthesizing. A measurement of photosynthesis is essentially a measurement of successful growth, and growth means successful use of ambient carbon. This animation represents nearly a decade's worth of data taken by the SeaWiFS instrument, showing the abundance of life in the sea and along the north eastern seaboard of the United States. Dark blue represents warmer areas where there is little life due to lack of nutrients, and greens and reds represent cooler nutrient-rich areas. The nutrient-rich areas include coastal regions where cold water rises from the sea floor bringing nutrients along and areas at the mouths of rivers where the rivers have brought nutrients into the ocean from the land. The nutrient-rich waters contribute to some of the oxygen-poor pockets of the seas called dead zones.

This animation begins with a wide shot of the United States and zooms down to the Northeastern seaboard of the United States while cycling through nearly ten years of SeaWiFS biosphere data.    This animation begins with a wide shot of the United States and zooms down to the Northeastern seaboard of the United States while cycling through nearly ten years of SeaWiFS biosphere data.
Duration: 2.7 minutes
Available formats:
  1280x720 (30 fps) MPEG-4   124 MB
  1280x720 (30 fps) MPEG-2   285 MB
  512x288 (30 fps) MPEG-1   41 MB
  1280x720 (30 fps) Frames (Northeast Biosphere data)
  1280x720 (60 fps) Frames (Northeast Biosphere data)
  320x180     PNG           257 KB
  160x80       PNG           62 KB
  80x40         PNG           16 KB
How to play our movies


This animation begins with a wide shot of the United States and zooms down to the Northeastern seaboard of the United States while cycling through nearly ten years of SeaWiFS biosphere data.  This animation is annotated with corresponding dates.    This animation begins with a wide shot of the United States and zooms down to the Northeastern seaboard of the United States while cycling through nearly ten years of SeaWiFS biosphere data. This animation is annotated with corresponding dates.
Duration: 1.8 minutes
Available formats:
  1280x720 (30 fps) MPEG-4   83 MB
  1280x720 (30 fps) MPEG-2   199 MB
  512x288 (30 fps) MPEG-1   35 MB
  1280x720 (30 fps) Frames (Northeast Biosphere data with dates)
  1280x720 (60 fps) Frames (Northeast Biosphere data with dates)
  320x180     PNG           238 KB
How to play our movies

Animation Number:3515
Animator:Alex Kekesi (SVS) (Lead)
Completed:2008-05-29
Producers:Laura Motel (UMBC)
 Maria Frostic (UMBC)
Scientist:Gene Feldman (NASA/GSFC)
Instrument:SeaStar/SeaWiFS
Data sets:Biosphere
 SeaWiFS
 SeaWiFS Biosphere
Data Collected:9/23/1997 - 9/20/2006
Series:SeaWiFS Biosphere
Keywords:
DLESE >> Biology
SVS >> HDTV
GCMD >> EARTH SCIENCE >> Biosphere
GCMD >> EARTH SCIENCE >> Biosphere >> Microbiota Taxonomy >> Phytoplankton
GCMD >> EARTH SCIENCE >> Biosphere >> Plant Taxonomy >> Phytoplankton
GCMD >> EARTH SCIENCE >> Hydrosphere >> Water Quality/Water Chemistry >> Oxygen
 
 
Please give credit for this item to
NASA/Goddard Space Flight Center Scientific Visualization Studio NASA/Goddard Space Flight Center, The SeaWiFS Project and ORBIMAGE, Scientific Visualization Studio. NOTE: All SeaWiFS images and data presented on this web site are for research and educational use only. All commercial use of SeaWiFS data must be coordinated with ORBIMAGE (http://www.orbimage.com).


Back to Top

USA.gov logo - the U.S. Government's official Web portal. + Privacy Policy and Important Notices
+ Reproduction Guidelines
NASA NASA Official:
Content Contact:
Curator: