Skip all navigation and jump to content Jump to site navigation Jump to section navigation.
NASA Logo - Goddard Space Flight Center + Visit NASA.gov
HOME PROJECTS RESOURCES SEARCH MAP

+ Advanced Search
Home
Home
View Most Recently Released Imagery
View Gallery of Imagery: A topical collection of SVS Imagery
Search Imagery by the keywords assigned to it
Search Imagery by the instruments that supplied data for a visualization product
Search Imagery by the series of visualizations that have been produced
Search Imagery by the scientist providing the data used in a visualization product
Search Imagery by the animator that created the product
Search Imagery by the identification number assigned to the visualization product
See other search options
Learn about the SVS Image Server
  + About the Server
  + Animation List
  + How to Use the Server


  + RSS Feeds
blank image
Previous Animation
Next Animation
MODIS Sea Surface Temperature from 2002 to 2006 around Australia

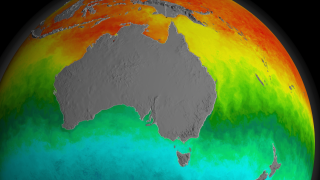
A recent study indicates there is a correlation between ocean nutrients and changes in sea surface temperature (SST). The results show that when ocean water warms, marine plant life in the form of microscopic phytoplankton tend to decline. When water cools, plant life flourishes. Changes in phytoplankton growth influence fishery yields and the amount of carbon dioxide the oceans remove from the atmosphere. This could have major implications on the future of our ocean's food web and how it relates to climate change.

The temperature data in this visualization comes from the Moderate Resolution Imaging Spectroradiometer (MODIS) onboard NASA's Terra and Aqua spacecraft.

In order to see the correlation between SST and SeaWiFS data, this animation can be compared to 'SeaWiFS Biosphere Data over Australia'. Please click here to see this other animation.


This animation shows a 32-day moving average of SST data around the world and around Australia.  This data continuously loops from July 4, 2002 to October 23, 2006.    This animation shows a 32-day moving average of SST data around the world and around Australia. This data continuously loops from July 4, 2002 to October 23, 2006.

Available formats:
  1280x720 (30 fps) Frames (Australian Sea Surface Temperatures)
  1280x720 (60 fps) Frames (Australian Sea Surface Temperatures)
  320x180     PNG           249 KB
  160x80       PNG           60 KB
  80x40         PNG           15 KB
  512x288 (30 fps) MPEG-1   38 MB
  1280x720 (30 fps) MPEG-2   142 MB
How to play our movies

Animation Number:3510
Animator:Alex Kekesi (SVS) (Lead)
Completed:2006-11-22
Scientist:Gene Feldman (NASA/GSFC)
Instruments:Aqua/MODIS
 Terra/MODIS
Data set:Biosphere
Data Collected:07/04/2002 - 10/23/2006
Series:Ocean Productivity
Keywords:
DLESE >> Biology
DLESE >> Ecology
SVS >> HDTV
DLESE >> Physical oceanography
GCMD >> EARTH SCIENCE >> Biosphere
GCMD >> EARTH SCIENCE >> Climate Indicators
GCMD >> EARTH SCIENCE >> Biosphere >> Ecological Dynamics >> Food-web Dynamics
More Information on this topic available at:
http://www.nasa.gov/centers/goddard/news/topstory/2006/warm_marine.html
Science paper:'Climate-Driven Trends in Contemporary Ocean Productivity', Nature, Dec. 7
 
 
Please give credit for this item to
NASA/Goddard Space Flight Center Scientific Visualization Studio

Data provided by: Norman Kuring (NASA/GSFC)


Back to Top

USA.gov logo - the U.S. Government's official Web portal. + Privacy Policy and Important Notices
+ Reproduction Guidelines
NASA NASA Official:
SVS Contact:
Curator: