Skip all navigation and jump to content Jump to site navigation Jump to section navigation.
NASA Logo - Goddard Space Flight Center + Visit NASA.gov
HOME PROJECTS RESOURCES SEARCH MAP

+ Advanced Search
Home
Home
View Most Recently Released Imagery
View Gallery of Imagery: A topical collection of SVS Imagery
Search Imagery by the keywords assigned to it
Search Imagery by the instruments that supplied data for a visualization product
Search Imagery by the series of visualizations that have been produced
Search Imagery by the scientist providing the data used in a visualization product
Search Imagery by the animator that created the product
Search Imagery by the identification number assigned to the visualization product
See other search options
Learn about the SVS Image Server
  + About the Server
  + Animation List
  + How to Use the Server


  + RSS Feeds
blank image
Previous Animation
Next Animation
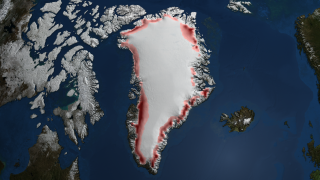
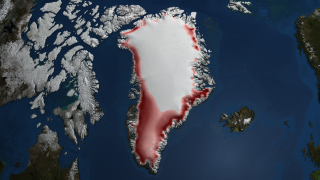
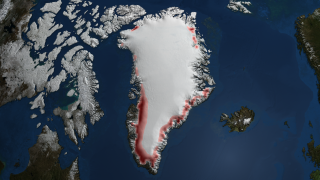
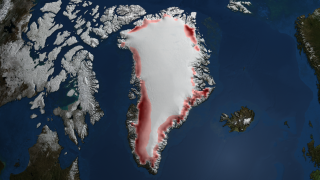
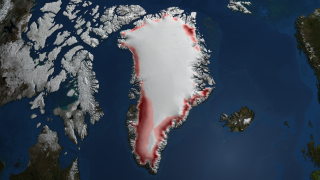
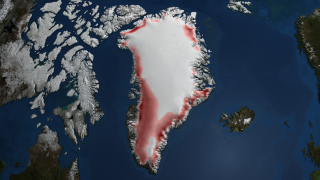
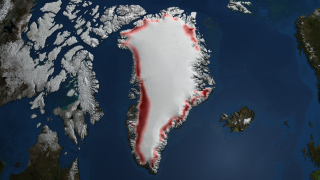
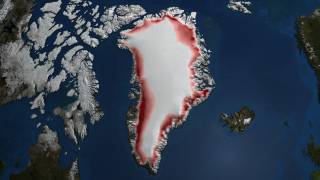
Annual Gradient Melt over Greenland 1979 through 2007

The ice sheet melt extent is a daily (or every-other-day, prior to August, 1987) estimate of the spatial extent of wet snow on the Greenland ice sheet derived from passive microwave satellite brightness temperature characteristics. This indicator of melt on each area of the ice sheet for each day of observation is physically based on the changes in microwave emission characteristics observable in data. Although it is not a direct measure of the snow wetness, it is representative of the amount of ice loss due to seasonal melting that occurs on the Greenland ice sheet.

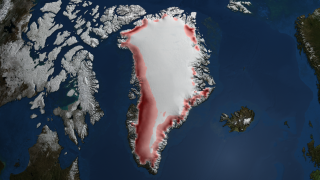
This animation is a time series showing the regions of the Greenland ice sheet where melt occurred for more than three days between May 1st and September 30th for each year. Areas in which melt occurred for longer time periods are shown in a darker red while those areas melted for fewer days are shown in lighter red. Areas melted three or less days during the year are not colored.


This animation shows the change in annual melt over Greenland for each year from 1979 through 2007.
The color depicts the number of melt days during the season.    This animation shows the change in annual melt over Greenland for each year from 1979 through 2007. The color depicts the number of melt days during the season.
Duration: 12.0 seconds
Available formats:
  1280x720 (30 fps) Frames
  1280x720 (60 fps) Frames
  320x180     PNG           269 KB
  512x288 (30 fps) MPEG-1   3 MB
  1280x720 (30 fps) MPEG-2   18 MB
  640x360 (30 fps) MPEG-4   771 KB
  1280x720 (30 fps) MPEG-4   1 MB
How to play our movies


Melt during 1979    Melt during 1979

Available formats:
  320 x 180         PNG 268 KB
  1280 x 720       TIFF 1 MB
  3840 x 2160     TIFF 10 MB


Melt during 1980    Melt during 1980

Available formats:
  320 x 180         PNG 269 KB
  1280 x 720       TIFF 1 MB
  3840 x 2160     TIFF 10 MB


Melt during 1981    Melt during 1981

Available formats:
  320 x 180         PNG 268 KB
  1280 x 720       TIFF 1 MB
  3840 x 2160     TIFF 10 MB


Melt during 1982    Melt during 1982

Available formats:
  320 x 180         PNG 268 KB
  1280 x 720       TIFF 1 MB
  3840 x 2160     TIFF 10 MB


Melt during 1983    Melt during 1983

Available formats:
  320 x 180         PNG 268 KB
  1280 x 720       TIFF 1 MB
  3840 x 2160     TIFF 10 MB


Melt during 1984    Melt during 1984

Available formats:
  320 x 180         PNG 269 KB
  1280 x 720       TIFF 1 MB
  3840 x 2160     TIFF 10 MB


Melt during 1985    Melt during 1985

Available formats:
  320 x 180         PNG 269 KB
  1280 x 720       TIFF 1 MB
  3840 x 2160     TIFF 10 MB


Melt during 1986    Melt during 1986

Available formats:
  320 x 180         PNG 269 KB
  1280 x 720       TIFF 1 MB
  3840 x 2160     TIFF 10 MB


Melt during 1987    Melt during 1987

Available formats:
  320 x 180         PNG 270 KB
  1280 x 720       TIFF 1 MB
  3840 x 2160     TIFF 10 MB


Melt during 1988    Melt during 1988

Available formats:
  320 x 180         PNG 269 KB
  1280 x 720       TIFF 1 MB
  3840 x 2160     TIFF 10 MB


Melt during 1989    Melt during 1989

Available formats:
  320 x 180         PNG 268 KB
  1280 x 720       TIFF 1 MB
  3840 x 2160     TIFF 10 MB


Melt during 1990    Melt during 1990

Available formats:
  1280 x 720       TIFF 1 MB
  320 x 180         PNG 268 KB
  3840 x 2160     TIFF 10 MB


Melt during 1991    Melt during 1991

Available formats:
  320 x 180         PNG 269 KB
  1280 x 720       TIFF 1 MB
  3840 x 2160     TIFF 10 MB


Melt during 1992    Melt during 1992

Available formats:
  320 x 180         PNG 269 KB
  1280 x 720       TIFF 1 MB
  3840 x 2160     TIFF 10 MB


Melt during 1993    Melt during 1993

Available formats:
  1280 x 720       TIFF 1 MB
  3840 x 2160     TIFF 10 MB
  320 x 180         PNG 269 KB


Melt during 1994    Melt during 1994

Available formats:
  1280 x 720       TIFF 1 MB
  3840 x 2160     TIFF 10 MB
  320 x 180         PNG 269 KB


Melt during 1995    Melt during 1995

Available formats:
  1280 x 720       TIFF 1 MB
  3840 x 2160     TIFF 10 MB
  320 x 180         PNG 269 KB


Melt during 1996    Melt during 1996

Available formats:
  1280 x 720       TIFF 1 MB
  3840 x 2160     TIFF 10 MB
  320 x 180         PNG 269 KB


Melt during 1997    Melt during 1997

Available formats:
  1280 x 720       TIFF 1 MB
  3840 x 2160     TIFF 10 MB
  320 x 180         PNG 268 KB


Melt during 1998    Melt during 1998

Available formats:
  1280 x 720       TIFF 1 MB
  3840 x 2160     TIFF 10 MB
  320 x 180         PNG 268 KB


Melt during 1999    Melt during 1999

Available formats:
  1280 x 720       TIFF 1 MB
  3840 x 2160     TIFF 10 MB
  320 x 180         PNG 268 KB


Melt during 2000    Melt during 2000

Available formats:
  1280 x 720       TIFF 1 MB
  3840 x 2160     TIFF 10 MB
  320 x 180         PNG 269 KB


Melt during 2001    Melt during 2001

Available formats:
  1280 x 720       TIFF 1 MB
  3840 x 2160     TIFF 10 MB
  320 x 180         PNG 268 KB


Melt during 2002    Melt during 2002

Available formats:
  1280 x 720       TIFF 1 MB
  3840 x 2160     TIFF 10 MB
  320 x 180         PNG 270 KB


Melt during 2003    Melt during 2003

Available formats:
  1280 x 720       TIFF 1 MB
  3840 x 2160     TIFF 10 MB
  320 x 180         PNG 268 KB


Melt during 2004
   Melt during 2004

Available formats:
  1280 x 720       TIFF 1 MB
  3840 x 2160     TIFF 10 MB
  320 x 180         PNG 270 KB


Melt during 2005    Melt during 2005

Available formats:
  1280 x 720       TIFF 1 MB
  3840 x 2160     TIFF 10 MB
  320 x 180         PNG 269 KB


Melt during 2006    Melt during 2006

Available formats:
  1280 x 720       TIFF 1 MB
  3840 x 2160     TIFF 10 MB
  320 x 180         PNG 269 KB


Melt during 2007    Melt during 2007

Available formats:
  1280 x 720       TIFF 1 MB
  3840 x 2160     TIFF 10 MB
  320 x 180         PNG 269 KB
  160 x 80           PNG 65 KB
  80 x 40             PNG 17 KB


Color bar showing days of melt during the season.  Regions of three or fewer days is not colored.  Regions of more than 75 days of melt are shown as the darkest red.
   Color bar showing days of melt during the season. Regions of three or fewer days is not colored. Regions of more than 75 days of melt are shown as the darkest red.

Available formats:
  320 x 90           PNG   8 KB

Animation Number:3476
Animator:Cindy Starr (SVS) (Lead)
Completed:2007-10-31
Scientist:Waleed Abdalati (NASA/GSFC)
Instruments:DMSP/SSMI
 Nimbus-7/SMMR
Data set:Greenland Ice Sheet Melt Characteristics
Data Collected:May 1 through September 30 each year from 1979 through 2007
Keywords:
DLESE >> Cryology
SVS >> HDTV
GCMD >> EARTH SCIENCE >> Cryosphere
GCMD >> EARTH SCIENCE >> Cryosphere >> Snow/Ice
GCMD >> EARTH SCIENCE >> Hydrosphere >> Snow/Ice
GCMD >> EARTH SCIENCE >> Cryosphere >> Sea Ice >> Ice Growth/Melt
GCMD >> EARTH SCIENCE >> Cryosphere >> Snow/Ice >> Freeze/Thaw
GCMD >> EARTH SCIENCE >> Cryosphere >> Snow/Ice >> Ice Growth/Melt
GCMD >> EARTH SCIENCE >> Cryosphere >> Snow/Ice >> Snow Melt
GCMD >> EARTH SCIENCE >> Hydrosphere >> Snow/Ice >> Snow Melt
SVS >> iPod
 
 
Please give credit for this item to
NASA/Goddard Space Flight Center Scientific Visualization Studio
The Next Generation Blue Marble data is courtesy of Reto Stockli (NASA/GSFC).


Back to Top

USA.gov logo - the U.S. Government's official Web portal. + Privacy Policy and Important Notices
+ Reproduction Guidelines
NASA NASA Official:
SVS Contact:
Curator: