Comparison of Minimum Sea Ice Between 2005 and 2007 - Split Screen
|
|
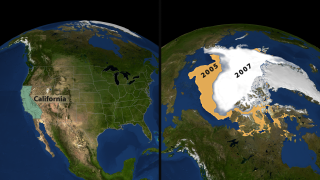
Sea ice is frozen seawater floating on the surface of the ocean. Some sea ice is semi-permanent, persisting from year to year, and some is seasonal, melting and refreezing from season to season. The sea ice cover reaches its minimum extent at the end of each summer and the remaining ice is called the perennial ice cover. The 2007 Arctic summer sea ice has reached the lowest extent of perennial ice cover on record - nearly 25% less than the previous low set in 2005. The area of the perennial ice has been steadily decreasing since the satellite record began in 1979, at a rate of about 10% per decade. But the 2007 minimum, reached on September 14, is far below the previous record made in 2005 and is about 38% lower than the climatological average. Such a dramatic loss has implications for ecology, climate and industry. This animation compares the difference between the perennial sea ice minimum extent on September 21, 2005 and September 14, 2007. With a split screen, the area of the melted region is compared with the size of the state of California.
|
|
|
|
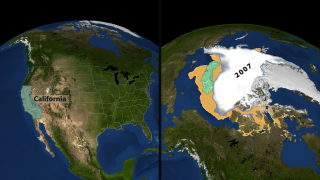
This animation shows a two zooms on a split screen: one to the United States and the other to the Arctic. The Arctic shows the 2005 sea ice minimum extent and fades to show the 2007 minimum extent. The state of California is placed in the melt region as a comparison of the area of the region.
Duration: 20.0 seconds
Available formats:
320x180
PNG
240 KB
160x80
PNG
60 KB
80x40
PNG
15 KB
640x360 (30 fps)
MPEG-4
1 MB
1280x720 (30 fps)
MPEG-4
8 MB
1280x720 (30 fps)
Frames (Composite)
1280x720 (60 fps)
Frames (Composite)
512x288 (30 fps)
MPEG-1
3 MB
1280x720 (30 fps)
MPEG-2
13 MB
How to play our movies
|
|
|
|
This is the background frame of the above animation without any text, state line or California overlay.
Available formats:
320x180
PNG
237 KB
1280x720 (30 fps)
Frames (Background)
1280x720 (60 fps)
Frames (Background)
How to play our movies
|
|
|
|
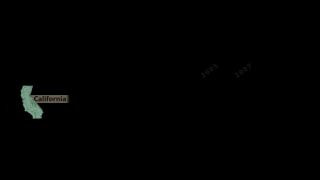
This contains only the overlay of the first movie consisting of text, state lines and California with a transparent background.
Available formats:
320x180
PNG
6 KB
1280x720 (30 fps)
Frames (Overlay)
1280x720 (60 fps)
Frames (Overlay)
How to play our movies
|
|
|
|
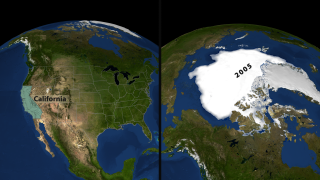
This image shows the 2005 minimum sea ice and compares its area to that of the state of California.
Available formats:
3840 x 2160
TIFF
18 MB
320 x 180
PNG
241 KB
|
|
|
|
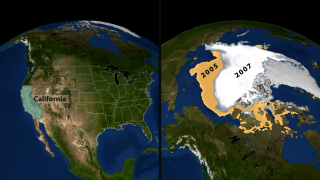
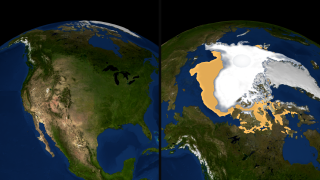
This image shows the 2005 minimum sea ice (in orange) compared to the 2007 minimum sea ice (in white). The difference in the minimum ice extent between 2005 and 2007 vastly exceeds the area of the state of California.
Available formats:
3840 x 2160
TIFF
18 MB
320 x 180
PNG
243 KB
|
|
|
|
This image shows the 2005 minimum sea ice (in orange) compared to the 2007 minimum sea ice (in white). A green region the size of the state of California is overlain on the melted area to serve as a reference.
Available formats:
3840 x 2160
TIFF
18 MB
320 x 180
PNG
244 KB
|
|
|
Back to Top
|

