NASA Scientists Research Global Precipitation
|
The Global Precipitation Climatology Project (GPCP) is an element of the Global Energy and Water Cycle Experiment (GEWEX) of the World Climate Research program (WCRP). It was established by the WCRP in 1986 with the initial goal of providing monthly mean precipitation data on a 2.5°× 2.5°latitude -longitude grid. Monthly mean precipitation estimates are being produced beginning in 1979 and planned to go through 2005. The GPCP has accomplished this by merging infrared and microwave satellite estimates of precipitation with rain gauge data from more than 6,000 stations. Infrared precipitation estimates are obtained from GOES (United States), GMS (Japan) and Meteosat (European Community) geostationary satellites and National Oceanic and Atmospheric Administration (NOAA) operational polar orbiting satellites. Microwave estimates are obtained from the U.S. Defense Meteorological Satellite Program (DMSP) satellites using the Special Sensor Microwave Imager (SSM/I). These data sets will be used to validate general circulation and climate models, study the global hydrological cycle and diagnose the variability of the global climate system. Data sets have been expanded so that in addition to the monthly mean product available, the GPCP now has a 2.5°×2.5° degree pentad data set starting in 1979 and a 1°×1° daily data set starting in 1997.
|
|
|
|
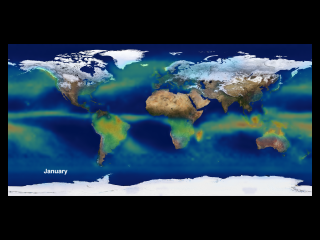
This animation of global precipitation cycles through the climatology data for the twelve months of the year and then repeats the cycle twice.
Duration: 24.0 seconds
Available formats:
2560x1920
TIFF
3 MB
1280x720 (60 fps)
Frames
320x240
PNG
227 KB
160x80
PNG
61 KB
80x40
PNG
16 KB
1280x720 (29.97 fps)
MPEG-4
19 MB
640x360 (30 fps)
MPEG-1
2 MB
320x180 (30 fps)
MPEG-1
1 MB
How to play our movies
|
|
|
|
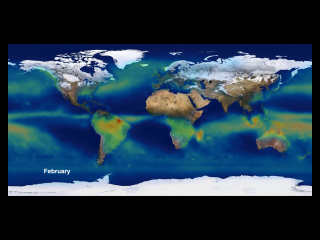
Averaged monthly rainfall for February from 1979 through 2006.
Available formats:
2560 x 1920
TIFF
3 MB
320 x 240
PNG
226 KB
|
|
|
|
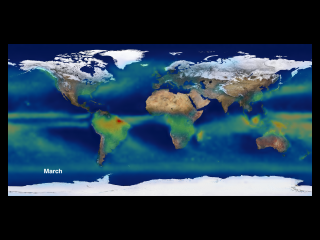
Averaged monthly rainfall for March from 1979 through 2006
Available formats:
2560 x 1920
TIFF
3 MB
320 x 240
PNG
226 KB
|
|
|
|
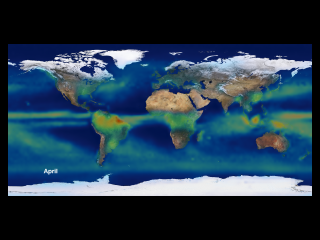
Averaged monthly rainfall for April from 1979 through 2006.
Available formats:
2560 x 1920
TIFF
3 MB
320 x 240
PNG
225 KB
|
|
|
|
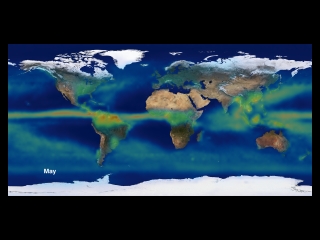
Averaged monthly rainfall for May from 1979 through 2006.
Available formats:
2560 x 1920
TIFF
2 MB
320 x 240
PNG
224 KB
|
|
|
|
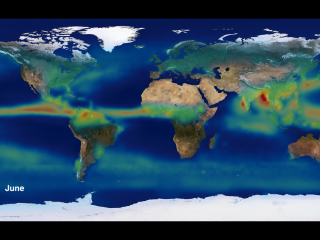
Averaged monthly rainfall for June from 1979 through 2006.
Available formats:
2560 x 1920
TIFF
2 MB
320 x 240
PNG
275 KB
|
|
|
|
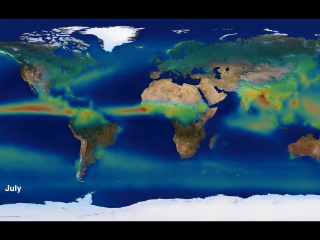
Averaged monthly rainfall for July from 1979 through 2006.
Available formats:
2560 x 1920
TIFF
2 MB
320 x 240
PNG
270 KB
|
|
|
|
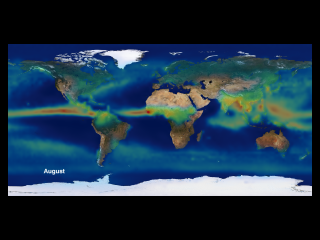
Averaged monthly rainfall for August from 1979 through 2006.
Available formats:
2560 x 1920
TIFF
2 MB
320 x 240
PNG
223 KB
|
|
|
|
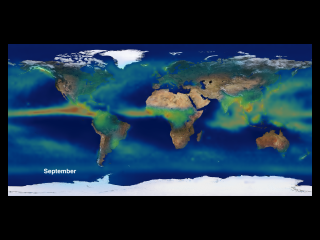
Averaged monthly rainfall for September from 1979 through 2006.
Available formats:
2560 x 1920
TIFF
2 MB
320 x 240
PNG
223 KB
|
|
|
|
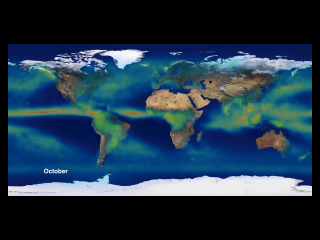
Averaged monthly rainfall for October from 1979 through 2006.
Available formats:
2560 x 1920
TIFF
3 MB
320 x 240
PNG
224 KB
|
|
|
|
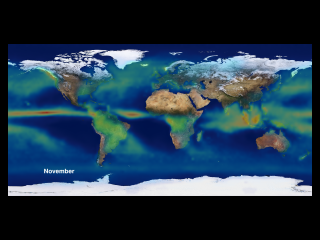
Averaged monthly rainfall for November from 1979 through 2006.
Available formats:
2560 x 1920
TIFF
3 MB
320 x 240
PNG
225 KB
|
|

|
|
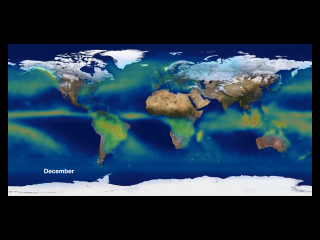
Averaged monthly rainfall for December from 1979 through 2006.
Available formats:
2560 x 1920
TIFF
3 MB
320 x 240
PNG
226 KB
|
|
|
|
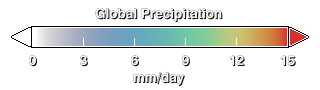
Colorbar
Available formats:
320 x 90
PNG
8 KB
|
|
|
Back to Top
|

