Skip all navigation and jump to content Jump to site navigation Jump to section navigation.
NASA Logo - Goddard Space Flight Center + Visit NASA.gov
HOME PROJECTS RESOURCES SEARCH MAP

+ Advanced Search
Home
Home
View Most Recently Released Imagery
View Gallery of Imagery: A topical collection of SVS Imagery
Search Imagery by the keywords assigned to it
Search Imagery by the instruments that supplied data for a visualization product
Search Imagery by the series of visualizations that have been produced
Search Imagery by the scientist providing the data used in a visualization product
Search Imagery by the animator that created the product
Search Imagery by the identification number assigned to the visualization product
See other search options
Learn about the SVS Image Server
  + About the Server
  + Animation List
  + How to Use the Server


  + RSS Feeds
blank image
Previous Animation
Next Animation
2007 Arctic Sea Ice from AMSR-E with Alaska in Foreground

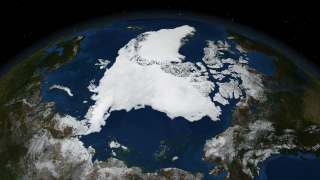
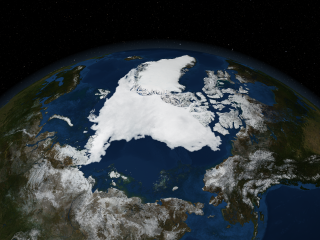
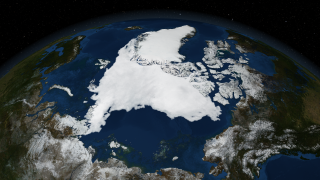
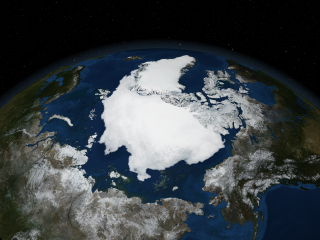
Sea ice is frozen seawater floating on the surface of the ocean. Some sea ice is semi-permanent, persisting from year to year, and some is seasonal, melting and refreezing from season to season. The sea ice cover reaches its minimum extent at the end of each summer and the remaining ice is called the perennial ice cover. The 2007 Arctic summer sea ice has reached the lowest extent of perennial ice cover on record - nearly 25% less than the previous low set in 2005. The area of the perennial ice has been steadily decreasing since the satellite record began in 1979, at a rate of about 10% per decade. But the 2007 minimum, reached on September 14, is far below the previous record made in 2005 and is about 38% lower than the climatological average. Such a dramatic loss has implications for ecology, climate and industry.

The AMSR-E instrument on the Aqua satellite acquires high resolution measurements of the 89 GHz brightness temperature near the poles. Because this is a passive microwave sensor which is not so sensitive to atmospheric effects, this sensor is able to observe the entire polar region every day, even through clouds and snowfall. This animation progresses at a rate of six frames per day from January 1, 2007 through the minimum extent which occurred on September 14, 2007. The false color of the sea ice, derived from the AMSR-E 6.25 km 89 GHz brightness temperature, highlights the fissures or divergence areas in the sea ice cover by warm brightness temperatures (in blue) while cold brightness temperatures, shown in brighter white, represent consolidated sea ice. The sea ice edge is defined by the 15% ice concentration contour in the three-day moving average of the AMSR-E 12.5 km sea ice concentration data while ice extent is the sum of all pixels with at least 15% ice.

An image of the sea ice on September 14, 2007 is included below, along with a corresponding image from September 21, 2005 showing the previous minimum sea ice extent.


This animation shows the Arctic sea ices from January 1, 2007 through September 14th, 2007 at a rate of 6 frames per day.    This animation shows the Arctic sea ices from January 1, 2007 through September 14th, 2007 at a rate of 6 frames per day.
Duration: 28.0 seconds
Available formats:
  1280x720 (60 fps) Frames
  1280x720 (30 fps) Frames
  512x288 (30 fps) MPEG-1   8 MB
  1280x720 (30 fps) MPEG-2   60 MB
  1280x720 (30 fps) MPEG-4   23 MB
  320x180     PNG           272 KB
How to play our movies


This image shows the minimum sea ice extent that occurred on September 14, 2007.    This image shows the minimum sea ice extent that occurred on September 14, 2007.

Available formats:
  3840 x 2160     TIFF 11 MB
  320 x 180         PNG 281 KB
  160 x 80           PNG 66 KB
  80 x 40             PNG 17 KB


This image also shows the minimum sea ice extent that occurred on September 14, 2007.  The view of this image matches the image below of the prior minimum sea ice that occurred on September 21, 2005.    This image also shows the minimum sea ice extent that occurred on September 14, 2007. The view of this image matches the image below of the prior minimum sea ice that occurred on September 21, 2005.

Available formats:
  2560 x 1920     TIFF 6 MB
  320 x 240         PNG 362 KB


This image shows the minimum sea ice that occurred on September 21, 2005. The view of this image matches the image above of the current  minimum sea ice that occurred on September 14, 2007.    This image shows the minimum sea ice that occurred on September 21, 2005. The view of this image matches the image above of the current minimum sea ice that occurred on September 14, 2007.

Available formats:
  2560 x 1920     TIFF 6 MB
  320 x 240         PNG 363 KB

Animation Number:3456
Animators:Cindy Starr (SVS) (Lead)
 Tom Bridgman (SVS)
Completed:2007-09-11
Scientist:Josefino Comiso (NASA/GSFC)
Instrument:Aqua/AMSR-E
Data sets:Daily L3 6.25 km 89 GHz Brightness Temperature (Tb)
 AMSR-E Level 3 12.5 km Sea Ice Concentration
Data Collected:2007-01-01 to 2007-09-14
Keywords:
DLESE >> Cryology
SVS >> HDTV
DLESE >> Physical oceanography
GCMD >> EARTH SCIENCE >> Cryosphere
GCMD >> EARTH SCIENCE >> Cryosphere >> Sea Ice
GCMD >> EARTH SCIENCE >> Cryosphere >> Snow/Ice
GCMD >> EARTH SCIENCE >> Hydrosphere >> Snow/Ice
GCMD >> EARTH SCIENCE >> Oceans >> Sea Ice
GCMD >> EARTH SCIENCE >> Cryosphere >> Sea Ice >> Ice Extent
GCMD >> EARTH SCIENCE >> Cryosphere >> Sea Ice >> Ice Growth/Melt
GCMD >> EARTH SCIENCE >> Cryosphere >> Sea Ice >> Ice Types
GCMD >> EARTH SCIENCE >> Cryosphere >> Sea Ice >> Pack Ice
GCMD >> EARTH SCIENCE >> Cryosphere >> Sea Ice >> Sea Ice Concentration
GCMD >> EARTH SCIENCE >> Cryosphere >> Sea Ice >> Sea Ice Motion
GCMD >> EARTH SCIENCE >> Cryosphere >> Snow/Ice >> Freeze/Thaw
GCMD >> EARTH SCIENCE >> Cryosphere >> Snow/Ice >> Ice Extent
GCMD >> EARTH SCIENCE >> Cryosphere >> Snow/Ice >> Ice Growth/Melt
GCMD >> EARTH SCIENCE >> Cryosphere >> Snow/Ice >> Ice Motion
GCMD >> EARTH SCIENCE >> Hydrosphere >> Snow/Ice >> Ice Extent
GCMD >> EARTH SCIENCE >> Hydrosphere >> Snow/Ice >> Ice Motion
GCMD >> EARTH SCIENCE >> Oceans >> Sea Ice >> Ice Extent
GCMD >> EARTH SCIENCE >> Oceans >> Sea Ice >> Ice Growth/Melt
GCMD >> EARTH SCIENCE >> Oceans >> Sea Ice >> Pack Ice
 
 
Please give credit for this item to
NASA/Goddard Space Flight Center Scientific Visualization Studio
The Next Generation Blue Marble data is courtesy of Reto Stockli (NASA/GSFC).


Back to Top

USA.gov logo - the U.S. Government's official Web portal. + Privacy Policy and Important Notices
+ Reproduction Guidelines
NASA NASA Official:
SVS Contact:
Curator: