Global Rotation of SeaWiFS Biosphere Decadal Average with Land
|
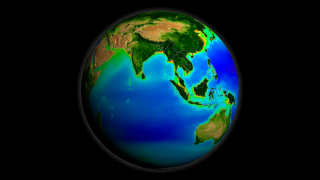
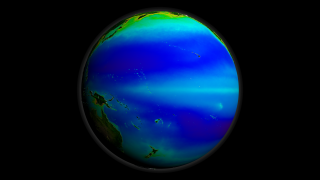
The SeaWiFS instrument aboard the Seastar satellite has been collecting ocean data since 1997. By monitoring the color of reflected light via satellite, scientists can determine how successfully plant life is photosynthesizing. A measurement of photosynthesis is essentially a measurement of successful growth, and growth means successful use of ambient carbon. This animation shows an average of 10 years worth of SeaWiFS data. Dark blue represents warmer areas where there tends to be a lack of nutrients, and greens and reds represent cooler nutrient-rich areas which support life. The nutrient-rich areas include coastal regions where cold water rises from the sea floor bringing nutrients along and areas at the mouths of rivers where the rivers have brought nutrients into the ocean from the land.
|
|
|
|
This animation depicts the 10-year average from 1997 to 2007 of SeaWiFS ocean chlorophyll concentration and land Normalized Difference Vegetation Index (NDVI) data on a rotating globe.
Duration: 1.8 minutes
Available formats:
1280x720 (60 fps)
Frames
320x180
PNG
103 KB
1280x720 (60 fps)
MPEG-4
32 MB
512x288 (60 fps)
MPEG-1
15 MB
1280x720 (60 fps)
MPEG-2
58 MB
512x288 (30 fps)
MPEG-1
10 MB
1280x720 (30 fps)
MPEG-2
29 MB
1280x720 (30 fps)
MPEG-4
32 MB
1280x720 (30 fps)
Frames
How to play our movies
|
|
|
|
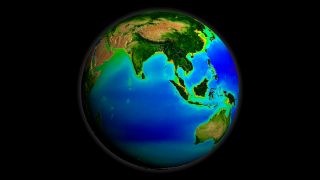
A print resolution picture of SeaWiFS global biosphere decadal average over Asia and Australia.
Available formats:
3840 x 2160
TIFF
4 MB
320 x 180
PNG
104 KB
160 x 80
PNG
28 KB
80 x 40
PNG
8 KB
|
|
|
|
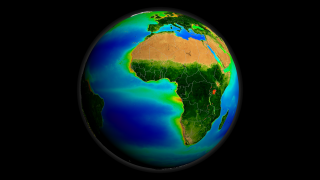
A print resolution picture of SeaWiFS global biosphere decadal average over Africa and Europe.
Available formats:
3840 x 2160
TIFF
3 MB
320 x 180
PNG
105 KB
|
|
|
|
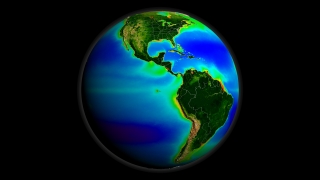
A print resolution picture of SeaWiFS global biosphere decadal average over the Americas.
Available formats:
3840 x 2160
TIFF
3 MB
320 x 180
PNG
101 KB
|
|

|
|
A print resolution picture of SeaWiFS global biosphere decadal average over the Pacific Ocean.
Available formats:
3840 x 2160
TIFF
2 MB
320 x 180
PNG
93 KB
|
|
|
Back to Top
|

