Skip all navigation and jump to content Jump to site navigation Jump to section navigation.
NASA Logo - Goddard Space Flight Center + Visit NASA.gov
HOME PROJECTS RESOURCES SEARCH MAP

+ Advanced Search
Home
Home
View Most Recently Released Imagery
View Gallery of Imagery: A topical collection of SVS Imagery
Search Imagery by the keywords assigned to it
Search Imagery by the instruments that supplied data for a visualization product
Search Imagery by the series of visualizations that have been produced
Search Imagery by the scientist providing the data used in a visualization product
Search Imagery by the animator that created the product
Search Imagery by the identification number assigned to the visualization product
See other search options
Learn about the SVS Image Server
  + About the Server
  + Animation List
  + How to Use the Server


  + RSS Feeds
blank image
Previous Animation
Next Animation
Aqua/AIRS Carbon Dioxide

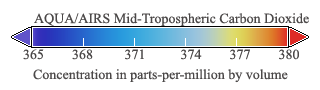
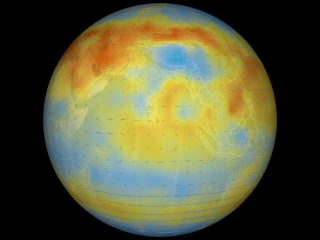
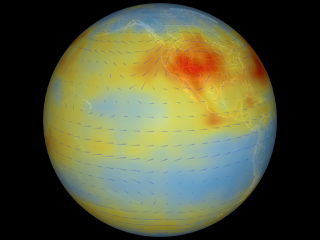
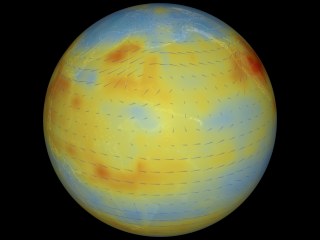
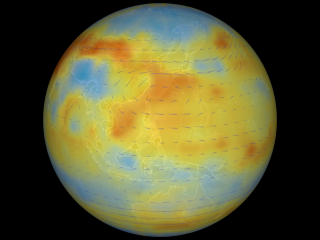
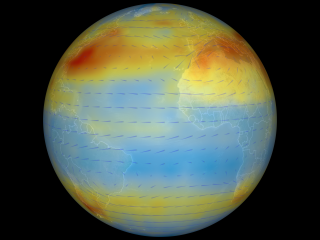
Although originally designed to measure atmospheric water vapor and temperature profiles for weather forecasting, data from the Atmospheric Infrared Sounder (AIRS) instrument on NASA's Aqua spacecraft are now also being used by scientists to observe atmospheric carbon dioxide. Scientists from NASA; the National Oceanic and Atmospheric Administration; the European Center for Medium-Range Weather Forecasts; the University of Maryland, Baltimore County; Princeton University, Princeton, New Jersey; and the California Institute of Technology (Caltech), Pasadena, Calif., are using several different methods to measure the concentration of carbon dioxide in the mid-troposphere (about eight kilometers, or five miles, above the surface). This visualization shows Aqua/AIRS mid-tropospheric carbon dioxide from July 2003. Low concentrations, 360 ppm, are shown in blue and high concentrations, 385 ppm, are shown in red. Notice that despite carbon dioxide's high degree of mixing, the regional patterns of atmospheric sources and sinks are still apparent in mid-troposphere carbon dioxide concentrations. This pattern of high carbon dioxide in the Northern Hemisphere (North America, Atlantic Ocean, and Central Asia) is consistent with model predictions.

For more information on AIRS, visit the AIRS Project Web Site: http://airs.jpl.nasa.gov. The AIRS data products are available at http://daac.gsfc.nasa.gov/AIRS/index.shtml.


AIRS is providing the global background of carbon dioxide.  This animation shows the monthly averaged carbon dioxide and monthly averaged static wind vectors from July 2003.    AIRS is providing the global background of carbon dioxide. This animation shows the monthly averaged carbon dioxide and monthly averaged static wind vectors from July 2003.
Duration: 20.0 seconds
Available formats:
  1280x720 (29.97 fps) MPEG-4   2 MB
  2560x1920 TIFF         2 MB
  1280x720 (59.94 fps) Frames
  320x240     PNG           213 KB
  160x80       PNG           44 KB
  80x40         PNG           12 KB
  512x288 (30 fps) MPEG-1   2 MB
How to play our movies


Carbon Dioxide Colortable
   Carbon Dioxide Colortable

Available formats:
  320 x 90           PNG   8 KB


Monthly average from July 2003 of carbon dioxide over the Pacific Ocean    Monthly average from July 2003 of carbon dioxide over the Pacific Ocean

Available formats:
  2560 x 1920     TIFF 2 MB
  320 x 240         PNG 214 KB


Monthly average of carbon dioxide from July 2003 over the Pacific Rim.    Monthly average of carbon dioxide from July 2003 over the Pacific Rim.

Available formats:
  2560 x 1920     TIFF 2 MB
  320 x 240         PNG 218 KB


Monthly averages of carbon dioxide for July 2003    Monthly averages of carbon dioxide for July 2003

Available formats:
  2560 x 1920     TIFF 2 MB
  320 x 240         PNG 218 KB


Monthly averages of carbon dioxide from July 2003    Monthly averages of carbon dioxide from July 2003

Available formats:
  2560 x 1920     TIFF 2 MB
  320 x 240         PNG 215 KB

Animation Number:3441
Animators:Lori Perkins (SVS) (Lead)
 Greg Shirah (SVS)
Completed:2007-07-06
Scientists:Tom Pagano (NASA/JPL CalTech)
 Edward Olsen (NASA/JPL CalTech)
Instrument:Aqua/AIRS
Data set:Wind
Data Collected:2003/07/01-31
Series:COGlobalTransport
Keywords:
DLESE >> Atmospheric science
SVS >> Carbon Dioxide
DLESE >> Chemistry
SVS >> HDTV
SVS >> Volume
GCMD >> EARTH SCIENCE >> Atmosphere >> Atmospheric Chemistry
GCMD >> EARTH SCIENCE >> Atmosphere >> Atmospheric Chemistry/Carbon and Hydrocarbon Compounds
This work has been visible on
Feature article at http://www.terra-marin.com/articles/greengov.php
 
 
Please give credit for this item to
NASA/Goddard Space Flight Center and NASA/Jet Propulsion Laboratory
Scientific Visualization Studio


Back to Top

USA.gov logo - the U.S. Government's official Web portal. + Privacy Policy and Important Notices
+ Reproduction Guidelines
NASA NASA Official:
SVS Contact:
Curator: