|
|
 |
MODIS Sea Surface Temperature Highlighting the Gulf Stream (2002 to 2006)
|
|
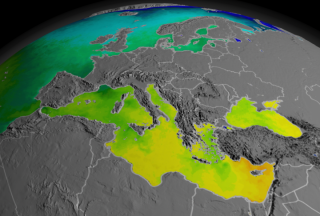
A recent study indicates a correlation between ocean nutrients and changes sea surface temperature (SST). The results show that when SSTs warm, marine plant life in the form of microscopic phytoplankton declines. Similarly, when SSTs cool, marine plant life seems to flourish. Changes in phytoplankton growth influence fishery yields and the amount of carbon dioxide the oceans remove from the atmosphere. This could have major implications on the future of our ocean's food web and how it relates to climate change. The temperature data in this visualization comes from the Moderate Resolution Imaging Spectroradiometer (MODIS) onboard NASA's Terra and Aqua spacecraft.
|
|
|
|
This animation shows a 32-day moving average of SST data spanning July 4, 2002 to October 23, 2006. The animation starts over Europe, pans across the Atlantic, and settles in over the Gulf Stream.
Duration: 24.0 seconds
Available formats:
720x480 (29.97 fps)
MPEG-2
20 MB
640x480 (29.97 fps)
MPEG-4
8 MB
640x480 (29.97 fps)
MPEG-1
10 MB
320x240 (29.97 fps)
MPEG-1
6 MB
1280x720 (29.97 fps)
MPEG-4
23 MB
1280x720 (59.94 fps)
Frames
1280x720 (59.94 fps)
MPEG-2
51 MB
720x486 (29.97 fps)
Frames
320x216
PNG
99 KB
160x80
PNG
21 KB
80x40
PNG
6 KB
How to play our movies
|
|
|
|
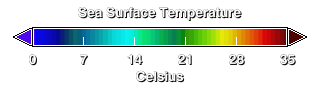
Sea Surface Temperature in Degrees Celsius.
Available formats:
320 x 90
PNG
9 KB
|
|
|
|
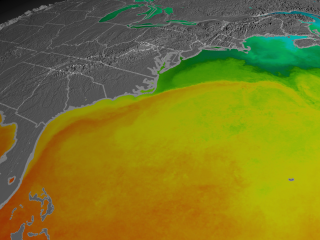
The Gulf Stream reflected in SST data. This data is an average from September 22, 2006 to October 23, 2006.
Available formats:
2560 x 1920
TIFF
5 MB
320 x 240
PNG
94 KB
|
|
|
Back to Top
|
|
|
|

