Skip all navigation and jump to content Jump to site navigation Jump to section navigation.
NASA Logo - Goddard Space Flight Center + Visit NASA.gov
HOME PROJECTS RESOURCES SEARCH MAP

+ Advanced Search
Home
Home
View Most Recently Released Imagery
View Gallery of Imagery: A topical collection of SVS Imagery
Search Imagery by the keywords assigned to it
Search Imagery by the instruments that supplied data for a visualization product
Search Imagery by the series of visualizations that have been produced
Search Imagery by the scientist providing the data used in a visualization product
Search Imagery by the animator that created the product
Search Imagery by the identification number assigned to the visualization product
See other search options
Learn about the SVS Image Server
  + About the Server
  + Animation List
  + How to Use the Server


  + RSS Feeds
blank image
Previous Animation
Next Animation
SeaWiFS Biosphere from 1997 to 2006

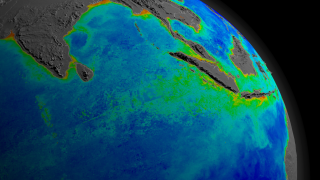
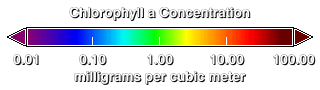
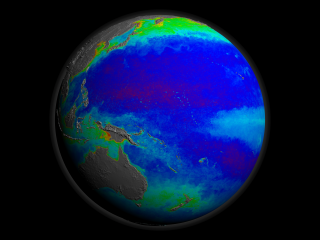
The SeaWiFS instrument aboard the Seastar satellite has been collecting ocean data since 1997. By monitoring the color of reflected light via satellite, scientists can determine how successfully plant life is photosynthesizing. A measurement of photosynthesis is essentially a measurement of successful growth, and growth means successful use of ambient carbon. This animation represents nearly a decade's worth of data taken by the SeaWiFS instrument, showing the abundance of life in the sea. Dark blue represents warmer areas where there is little life due to lack of nutrients, and greens and reds represent cooler nutrient-rich areas. The nutrient-rich areas include coastal regions where cold water rises from the sea floor bringing nutrients along and areas at the mouths of rivers where the rivers have brought nutrients into the ocean from the land.

A recent study indicates there is a correlation between this ocean nutrients and changes in sea surface temperature (SST). The results show that when SSTs warm, marine plant life in the form of microscopic phytoplankton declines. When SSTs cool, marine plant life flourishes. Changes in phytoplankton growth influence fishery yields and the amount of carbon dioxide the oceans remove from the atmosphere. This could have major implications on the future of our ocean's food web and how it relates to climate change.

Once the animation pulls out to a full global view, the remaining animation can be compared to the animation titled 'MODIS Sea Surface Temperature from 2002 to 2006'. Please click here to view the corresponding animation.


This animation shows a 32-day moving average of global SeaWiFS data spanning from August 29, 1997 to October 23, 2006.    This animation shows a 32-day moving average of global SeaWiFS data spanning from August 29, 1997 to October 23, 2006.
Duration: 53.0 seconds
Available formats:
  1280x720 (59.94 fps) Frames
  1280x720 (59.94 fps) MPEG-2   80 MB
  640x480 (29.97 fps) MPEG-1   20 MB
  320x240 (29.97 fps) MPEG-1   9 MB
  720x480 (29.97 fps) MPEG-2   31 MB
  640x480 (29.97 fps) MPEG-4   20 MB
  1280x720 (29.97 fps) MPEG-4   49 MB
  720x486 (29.97 fps) Frames
  320x180     PNG           73 KB
  160x80       PNG           18 KB
  80x40         PNG           5 KB
  1024x512   Frames (Cartesian)
  2048x1024 Frames (Cartesian)
How to play our movies

This product is available through our Web Map Service.   Click here to learn more.


Legend for the global biosphere animation. Reds and yellows denote areas of high ocean chlorophyll and blue and purple denote low concentrations.
   Legend for the global biosphere animation. Reds and yellows denote areas of high ocean chlorophyll and blue and purple denote low concentrations.

Available formats:
  320 x 90           PNG 13 KB


32-day average of SeaWiFS data over the Pacific Ocean.  This data has been averaged over September 22, 2006 to October 23, 2006.    32-day average of SeaWiFS data over the Pacific Ocean. This data has been averaged over September 22, 2006 to October 23, 2006.

Available formats:
  2560 x 1920     TIFF 3 MB
  320 x 240         PNG 62 KB

Animation Number:3387
Animators:Alex Kekesi (SVS) (Lead)
 Stuart A. Snodgrass (SVS)
 Lori Perkins (SVS)
Completed:2006-11-22
Scientist:Gene Feldman (NASA/GSFC)
Instrument:SeaStar/SeaWiFS
Data set:Biosphere
Data Collected:08/29/1997 - 10/23/2006
Series:Ocean Productivity
Goddard TV Tape:G2007-001HD -- NASA's HD Climate Change Resource Tape
Keywords:
DLESE >> Biology
DLESE >> Ecology
SVS >> HDTV
DLESE >> Physical oceanography
GCMD >> EARTH SCIENCE >> Biosphere
GCMD >> EARTH SCIENCE >> Climate Indicators
GCMD >> EARTH SCIENCE >> Biosphere >> Ecological Dynamics >> Food-web Dynamics
More Information on this topic available at:
http://www.nasa.gov/centers/goddard/news/topstory/2006/warm_marine.html
DEPC Metadata is available in
biosphere-1024.depc
biosphere-2048.depc
Science paper:'Climate-Driven Trends in Contemporary Ocean Productivity', Nature, Dec. 7
 
 
Please give credit for this item to
NASA/Goddard Space Flight Center Scientific Visualization Studio

Data provided by: Norman Kuring (NASA/GSFC)


Back to Top

USA.gov logo - the U.S. Government's official Web portal. + Privacy Policy and Important Notices
+ Reproduction Guidelines
NASA NASA Official:
SVS Contact:
Curator: