|
|
 |
Sea Surface Temperature from June 1, 2005 to August 29, 2005
|
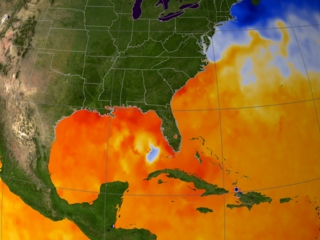
This visualization shows the sea surface temperatures for the 2005 Atlantic hurricane season from June 1, 2005 through August 29, 2005. The ocean colors represent the sea surface temperatures. Orange and red depict regions that are 82 degrees F and higher, where the ocean is warm enough for hurricanes to form. Hurricane winds are sustained by the heat energy of the ocean, so the ocean is cooled as the hurricane passes and the energy is extracted to power the winds. The sea surface temperatures were measured by the AMSR-E instrument on the Aqua satellite. Several hurricane color water trails can be seen through this animation - particulary hurricanes Dennis, Emily, and Katrina.
|
|

|
|
Sea surface temperature from June 1, 2005 through August 29, 2005
Duration: 1.3 minutes
Available formats:
320x240 (30 fps)
MPEG-1
3 MB
640x480 (30 fps)
MPEG-1
14 MB
720x480 (29.97 fps)
MPEG-2
23 MB
720x486 (30 fps)
Frames
320x240
JPEG
10 KB
1280x720 (29.97 fps)
MPEG-2
167 MB
1280x720 (30 fps)
Frames
How to play our movies
|
|
|
|
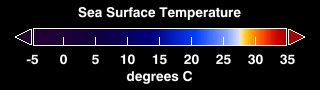
Color bar for sea surface temperatures (blue=15 degrees C, white= 27.7 degrees C, red=30+ degrees C)
Available formats:
320 x 90
TIFF
11 KB
320 x 90
JPEG
1 KB
|
|
|
|
Sea surface temperature on Aug 29, 2005
Available formats:
2560 x 1920
TIFF
6 MB
320 x 240
JPEG
59 KB
80 x 40
PNG
6 KB
160 x 80
PNG
21 KB
|
|
|
Back to Top
|
|
|
|

