SOHO/MDI Investigates Solar Flows Under Sunspots
|
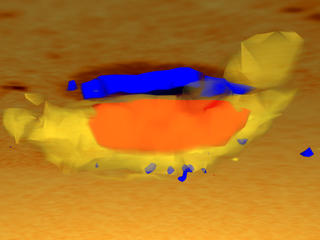
SOHO/MDI performs a 'sonogram' of the sun, revealing the subsurface temperature profile around a sunspot. Red isosurfaces denote regions where the sound speed (and temperature) are higher than average while blue isosurfaces directly under the spot illustrate where the sound speed (and temperature) are lower than average.
|
|

|
|
Zoom down to and below the solar surface to see temperature isosurfaces below the sunspot.
Duration: 21.0 seconds
Available formats:
720x486 (30 fps)
Frames
1280x720 (30 fps)
Frames
512x288 (30 fps)
MPEG-1
2 MB
640x480 (30 fps)
MPEG-1
10 MB
320x240 (30 fps)
MPEG-1
2 MB
320x180
JPEG
2 KB
320x240
JPEG
3 KB
320x240
JPEG
3 KB
720x480 (29.97 fps)
MPEG-2
17 MB
1280x720 (30 fps)
MPEG-2
46 MB
720x480 (29.97 fps)
DV
75 MB
How to play our movies
|
|
|
|
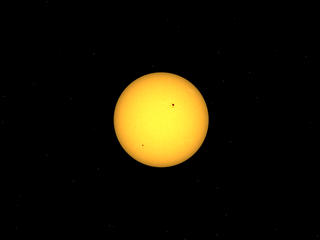
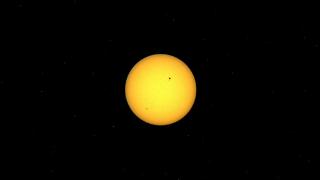
A full view of the sun at the start of the fly-in.
Available formats:
2560 x 1920
TIFF
591 KB
320 x 240
JPEG
3 KB
160 x 80
PNG
3 KB
|
|
|
|
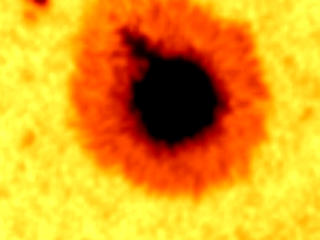
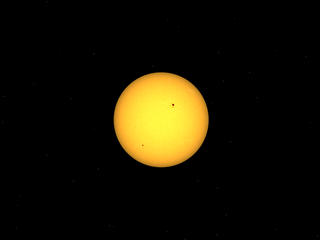
A close-up view of the sunspot in the region of interest.
Available formats:
2560 x 1920
TIFF
1 MB
320 x 240
JPEG
10 KB
160 x 80
PNG
13 KB
|
|
|
|
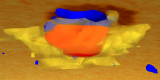
Just below the solar surface, we can display isosurfaces of temperature anomalies. Blue is cooler than average, red is warmer than average, and yellow is just a little warmer than average.
Available formats:
2560 x 1920
TIFF
1 MB
320 x 240
JPEG
10 KB
|
|

|
|
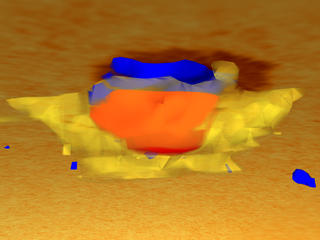
A view of the subsurface sunspot structure from another angle.
Available formats:
2560 x 1920
TIFF
2 MB
160 x 80
PNG
17 KB
320 x 240
JPEG
11 KB
80 x 40
PNG
5 KB
|
|
|
|
Slate title from video tape reads, 'SOHO/MDI Peers Beaneath Sunspots.'
Available formats:
720 x 528
JPEG
129 KB
320 x 234
PNG
362 KB
|
| Animation Number: | 2232 |
| Animator: | Tom Bridgman (SVS) (Lead) |
| Completed: | 2001-08-31 |
| Scientists: | Neal Hurlburt (LMSAL) |
| | Junwei Zhao (Stanford University) |
| | Alexander G. Kosovichev (Stanford University) |
| | Thomas L. Duvall (NASA/GSFC) |
| | Phil Sherrer (Stanford University) |
| | A. M. Rucklidge (University of Cambridge) |
| Instrument: | SOHO/MDI |
| Data Collected: | 1998/06/18 |
| Series: | SOHO/MDI Helioseismology |
| Video: | SVS2001-0026 * |
Keywords:
SVS
>> HDTV
SVS
>> Helioseismology
DLESE
>> Space science
SVS
>> Sun
GCMD
>> EARTH SCIENCE
>> Sun-earth Interactions
>> Solar Activity
>> Sunspots
|
More Information on this topic available at:
http://www.gsfc.nasa.gov/topstory/20010919sunspot.html
|
| Science paper: | Zhao, J., Kosovichev, A.G., and Duvall, T.L. 2001, Astrophysical Journal, 557, 384.
Hurlburt, N.E. and Rucklidge, A.M. 2000, Monthly Notices of the Royal Astronomical Society, 314, 793 |
|
Please give credit for this item to
NASA/Goddard Space Flight Center
Scientific Visualization Studio |
*Please note: the SVS does not fulfill requests for copies of the tapes in our library. On some of our animation pages, there is a direct link to a video distribution service from which tapes, handled by the Public Affairs Office (PAO)/Goddard TV, including some of our animations may be ordered. General information on this service can be found here. |
|
Back to Top
|

