Sea Surface Temp and Hurricane Connections: TRMM and GOES, Aug. 22, 1998 through Sept. 3, 1998 (Deluxe version)
|
For years scientists have known of the strong correlation between sea surface temperature and the intensity of hurricanes. But one of the major stumbling blocks for forecasters has been the precise measurement of those temperatures when a storm begins to form. Traditional techniques for sea surface temperature measurement can not see through clouds. Now researchers using the TRMM (Tropical Rainfall Measuring Mission) satellite have developed a technique for looking through clouds that is likely to enhance forecasters' abilities to predict hurricane intensity before their massive energies fully develop. A hurricane gathers energy from warm waters found in tropical latitudes. As Hurricane Bonnie crosses the Atlantic, it leaves a cooler trail of water in its wake. As Hurricane Danielle crosses Bonnie's path, the wind speed of the second storm drops markedly, as available energy to fuel the storm's engine drops off. As Danielle crosses Bonnie's wake, however, winds speeds increase due to temperature increases in surface water around the storm. This version Includes a speed bar showing Danielle's wind speed and a date annotation.
|
|

|
|
An animation of clouds from GOES and sea surface temperatures from TRMM in the Atlantic from August 22, 1998 through September 3, 1998. The ocean is cooled by the passage of Hurricane Bonnie causing a decrease in the wind speed in Hurricane Danielle. This is the high definition version.
Duration: 30.0 seconds
Available formats:
1280x720 (30 fps)
MPEG-2
24 MB
320x240 (15 fps)
QUICKTIME
4 MB
352x240 (29.97 fps)
MPEG-1
3 MB
320x242
JPEG
14 KB
320x240
JPEG
15 KB
320x242
JPEG
14 KB
720x480 (29.97 fps)
MPEG-2
22 MB
720x480 (29.97 fps)
DV
103 MB
How to play our movies
|
|
|
|
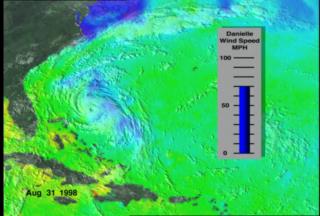
A combined image of clouds from GOES and sea surface temperatures from TRMM in the Atlantic on August 31, 1998. This image shows Hurricane Danielle right on top of the cooler ocean region caused by Hurricane Bonnie.
Available formats:
720 x 486
TIFF
1021 KB
320 x 216
JPEG
15 KB
|
|
|
|
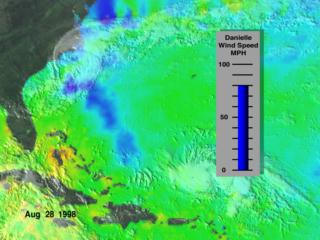
A combined image of clouds from GOES and sea surface temperatures from TRMM in the Atlantic on August 28, 1998. This image shows Hurricane Danielle right on top of the cooler ocean region caused by Hurricane Bonnie.
Available formats:
2560 x 1920
TIFF
14 MB
160 x 80
PNG
23 KB
320 x 240
JPEG
16 KB
80 x 40
PNG
6 KB
|
|

|
|
Color bar for sea surface temperature
Available formats:
512 x 50
TIFF
75 KB
378 x 37
JPEG
3 KB
|
|
|
Back to Top
|

