Skip all navigation and jump to content Jump to site navigation Jump to section navigation.
NASA Logo - Goddard Space Flight Center + Visit NASA.gov
HOME PROJECTS RESOURCES SEARCH MAP

+ Advanced Search
Home
Home
View Most Recently Released Imagery
View Gallery of Imagery: A topical collection of SVS Imagery
Search Imagery by the keywords assigned to it
Search Imagery by the instruments that supplied data for a visualization product
Search Imagery by the series of visualizations that have been produced
Search Imagery by the scientist providing the data used in a visualization product
Search Imagery by the animator that created the product
Search Imagery by the identification number assigned to the visualization product
See other search options
Learn about the SVS Image Server
  + About the Server
  + Animation List
  + How to Use the Server


  + RSS Feeds
blank image
Previous Animation
Next Animation
Pacific Anthropogenic Aerosol Optical Depth (AOD) in 2003

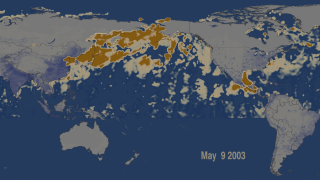
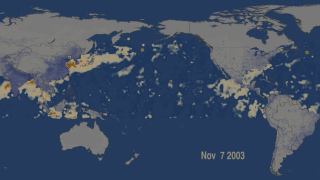
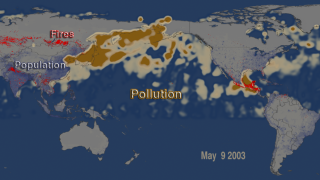
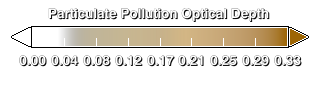
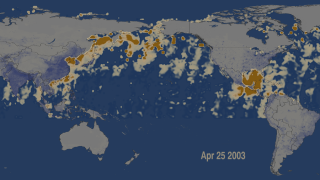
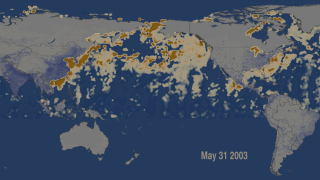
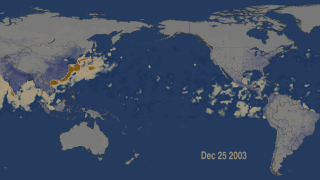
According to measurements taken with a satellite instrument, vast quantities of industrial aerosols and smoke from biomass burning in East Asia and Russia are traveling from one side of the globe to another. Explosive economic growth in Asia has profound implications for the atmosphere worldwide. Data collected by a NASA satellite shows a dense blanket of polluted air over the Northwestern Pacific. This brown cloud is a toxic mix of ash, acids, and airborne particles from car and factory emissions, as well as from low-tech polluters like coal-burning stoves and from forest fires. This image generated by data from NASA’s instrument called MODIS (Moderate Resolution Imaging Spectroradiometer) onboard the Terra satellite demonstrates how large and pervasive this transport phenomenon is across vast areas.

China’s exports fill shelves around the world…but according to a new NASA research paper, China also heavily exports pollution. This week, space agency scientists reveal how Chinese industrialization and Russian forest fires in combination with pollution transported eastward from Europe send roughly 18 teragrams — almost 40 billion pounds—of pollution aerosols into the atmosphere over the Northwestern Pacific every year. The MODIS instrument on NASA’s Terra satellite has been tracking the particulate pollution for more than seven years, gathering data as most of it drifted east across the Pacific Ocean. About 4.5 teragrams of particulate pollution each year could reach the western boundary of North America, which is about 15% of local emissions of particulate pollutants from the U.S. and Canada.

In the last two decades, China has more than doubled its pollution production. This boom may be contributing to substantial changes in climate and weather in places far from the origin of the particulates. Never in human history—anywhere—has there been industrial growth like that in modern China. But with fast growth comes unintended consequences, and from space evidence of those consequences is starting to emerge.

The research relies on measurements of something called “aerosol optical thickness”. It’s a quantitative measurement about how well a slice of atmosphere transmits light. The greater the value of optical thickness for a given location, the less light of a particular wavelength can pass through it. Measurements of aerosol optical thickness describe quantities of tiny particles in a given volume. By measuring how much light can penetrate a region of atmosphere across a variety of wavelengths, scientists can make certain inferences about the quantity and type of particles blocking that light.

This visualization shows the seasonal variations of transport of pollution aerosols across the North Pacific. The East Asian airstream carries its largest pollution loading in spring and smallest in summer and fall. With heavy concentrations of aerosols represented by shades of brown, scientists can track the origins and distribution of the particles as they travel in the atmosphere.

The sequence also shows a trail of substantial aerosol concentrations from a variety of sources. These sources include heavy industrial activity in East Asia associated with high population density represented in this sequence by gradations of black covering the land surface, and intense Russian forest fires in high latitudes.


This movie shows a three day moving average of anthropogenic aerosols over the Pacific in 2003.  Human population is shown in blue/purple.  On May 9, 2003 a heavy pollution plume is being transported over the Pacific from Asia to North America.    This movie shows a three day moving average of anthropogenic aerosols over the Pacific in 2003. Human population is shown in blue/purple. On May 9, 2003 a heavy pollution plume is being transported over the Pacific from Asia to North America.
Duration: 48.0 seconds
Available formats:
  1280x720 (30 fps) MPEG-4   6 MB
  640x360 (30 fps) MPEG-4   8 MB
  1280x720 (60 fps) Frames
  1280x720 (30 fps) Frames
  3840x2160 TIFF         6 MB
  320x180     PNG           245 KB
  160x80       PNG           59 KB
  80x40         PNG           15 KB
  720x480 (29.97 fps) QUICKTIME 166 MB
How to play our movies


Nov 7, 2003
Areas in purple on the land surface represent human population. Notice how heavy aerosol production and dense population areas correspond.    Nov 7, 2003 Areas in purple on the land surface represent human population. Notice how heavy aerosol production and dense population areas correspond.

Available formats:
  3840x2160 TIFF         6 MB
  320x180     PNG           239 KB
  1280x720 (30 fps) Frames
How to play our movies


This movie shows the same three day moving average of particulate pollution optical depth and human population. It does not have the date overlaid.    This movie shows the same three day moving average of particulate pollution optical depth and human population. It does not have the date overlaid.
Duration: 48.0 seconds
Available formats:
  1280x720 (60 fps) Frames
  1280x720 (30 fps) MPEG-4   5 MB
  512x288 (30 fps) MPEG-1   7 MB
  320x180     PNG           245 KB
How to play our movies


In this picture, heavy aerosol concentrations appear in shades of brown, with darker shades representing greater concentrations. Areas of purple on the land surface represent human population. Notice how heavy aerosol production and dense population areas correspond. Also notice how there are dense patches of red points in East Asia. These correspond with intense forest fires, sending vast quantities of aerosols into the atmosphere. Although this image gives the impression that the fires and plumes of aerosols may not be connected, in fact they are. There’s a direct relationship between those fire point and the brown patches appearing to the East.    In this picture, heavy aerosol concentrations appear in shades of brown, with darker shades representing greater concentrations. Areas of purple on the land surface represent human population. Notice how heavy aerosol production and dense population areas correspond. Also notice how there are dense patches of red points in East Asia. These correspond with intense forest fires, sending vast quantities of aerosols into the atmosphere. Although this image gives the impression that the fires and plumes of aerosols may not be connected, in fact they are. There’s a direct relationship between those fire point and the brown patches appearing to the East.

Available formats:
  1280 x 720       TIFF 2 MB
  320 x 180         PNG 242 KB
  3840 x 2160     TIFF 6 MB


Colorbar - particulates are measured in micrometers.
   Colorbar - particulates are measured in micrometers.

Available formats:
  320 x 90           PNG 10 KB


April 25, 2003
With heavy concentrations of aerosols represented by shades of brown, scientists can track the origins and distribution of the particles as they travel in the atmosphere.    April 25, 2003 With heavy concentrations of aerosols represented by shades of brown, scientists can track the origins and distribution of the particles as they travel in the atmosphere.

Available formats:
  3840 x 2160     TIFF 6 MB
  320 x 180         PNG 245 KB


May 31, 2003
 The MODIS instrument on NASA’s Terra satellite has been tracking the particulate pollution for more than seven years, gathering data as most of it drifted east across the Pacific Ocean. About 4.5 teragrams of particulate pollution each year could reach the western boundary of North America, which is about 15% of local emissions of particulate pollutants from the U.S. and Canada.  	   May 31, 2003 The MODIS instrument on NASA’s Terra satellite has been tracking the particulate pollution for more than seven years, gathering data as most of it drifted east across the Pacific Ocean. About 4.5 teragrams of particulate pollution each year could reach the western boundary of North America, which is about 15% of local emissions of particulate pollutants from the U.S. and Canada.

Available formats:
  3840 x 2160     TIFF 6 MB
  320 x 180         PNG 246 KB


Dec 25, 2003
In the last two decades, China has more than doubled its pollution production. This boom may be contributing to substantial changes in climate and weather in places far from the origin of the particulates.    Dec 25, 2003 In the last two decades, China has more than doubled its pollution production. This boom may be contributing to substantial changes in climate and weather in places far from the origin of the particulates.

Available formats:
  3840 x 2160     TIFF 6 MB
  320 x 180         PNG 234 KB

Animation Number:3491
Animator:Lori Perkins (SVS) (Lead)
Completed:2008-02-29
Producer:Michael Starobin (HTSI)
Scientist:Hongbin Yu (JCET UMBC)
Writer:Michael Starobin (HTSI)
Data set:Anthropogenic Aerosol Optical Depth
Data Collected:2003/1 - 365
Series:Aerosols and Warming
Keywords:
SVS >> Aerosols
DLESE >> Atmospheric science
SVS >> Dust
SVS >> HDTV
SVS >> Pollution
This work has been visible on
http://www.sciencedaily.com/releases/2008/03/080317164336.htm
 
 
Please give credit for this item to
NASA/Goddard Space Flight Center
Scientific Visualization Studio


Back to Top

USA.gov logo - the U.S. Government's official Web portal. + Privacy Policy and Important Notices
+ Reproduction Guidelines
NASA NASA Official:
Content Contact:
Curator: