2007 Sea Surface Temperatures in the Gulf of Mexico
|
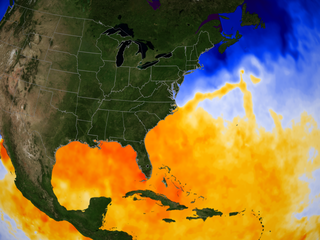
Sea surface temperatures in the Gulf of Mexico rise due to natural summer warming. These warm surface temperatures are a contributing factor to favorable conditions that can lead to the formation of tropical storms and hurricanes in the Gulf of Mexico and off the Eastern Shore of the United States. In general, hurricanes tend to form over warm ocean water whose temperature is 82 degrees Fahrenheit (approximately 27.7 degrees Celsius) or higher. These areas are depicted in yellow, orange, and red. This data was taken by the AMSR-E instrument aboard the Aqua satellite.
|
|

|
|
This animation shows the progression of warm waters slowly filling the Gulf of Mexico in 2007(shown in yellow, orange, and red). This natural annual warming contributes to the possible formation of hurricanes in the Gulf. SST data shown here ranges from January 1, 2007 to December 31, 2007.
Duration: 14.0 seconds
Available formats:
720x480 (29.97 fps)
MPEG-2
12 MB
640x480 (30 fps)
MPEG-1
10 MB
320x240 (30 fps)
MPEG-1
7 MB
720x486 (29.97 fps)
Frames (Dates)
720x486 (29.97 fps)
Frames (Sst)
320x216
PNG
331 KB
How to play our movies
|
|

|
|
The legend for sea surface temperature. The color scale ranges from dark blue for areas below 15C to dark red for regions above 35C.
Available formats:
320 x 90
PNG
9 KB
|
|

|
|
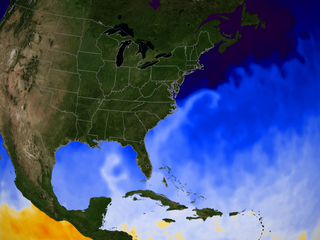
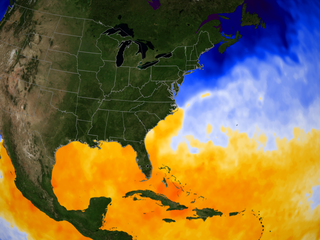
Sea surface temperature in the Gulf of Mexico and the Atlantic on 2007-01-01.
Available formats:
2560 x 1920
TIFF
4 MB
320 x 240
PNG
116 KB
160 x 80
PNG
64 KB
80 x 40
PNG
17 KB
|
|

|
|
Sea surface temperature in the Gulf of Mexico and the Atlantic on 2007-02-0
Available formats:
2560 x 1920
TIFF
4 MB
320 x 240
PNG
113 KB
|
|

|
|
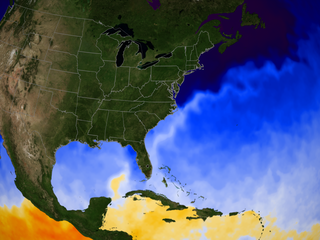
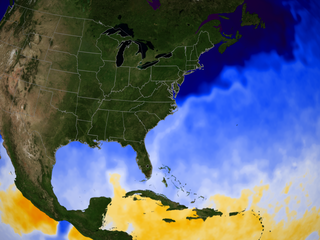
Sea surface temperature in the Gulf of Mexico and the Atlantic on 2007-03-01.
Available formats:
2560 x 1920
TIFF
4 MB
320 x 240
PNG
369 KB
|
|
|
|
Sea surface temperature in the Gulf of Mexico and the Atlantic on 2007-04-01.
Available formats:
2560 x 1920
TIFF
4 MB
320 x 240
PNG
371 KB
|
|
|
|
Sea surface temperature in the Gulf of Mexico and the Atlantic on 2007-05-01.
Available formats:
2560 x 1920
TIFF
4 MB
320 x 240
PNG
372 KB
|
|

|
|
Sea surface temperature in the Gulf of Mexico and the Atlantic on 2007-06-01.
Available formats:
2560 x 1920
TIFF
4 MB
320 x 240
PNG
376 KB
|
|
|
|
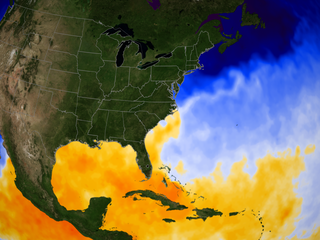
Sea surface temperature in the Gulf of Mexico and the Atlantic on 2007-07-01.
Available formats:
2560 x 1920
TIFF
4 MB
320 x 240
PNG
373 KB
|
|
|
|
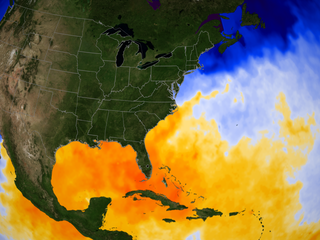
Sea surface temperature in the Gulf of Mexico and the Atlantic on 2007-08-01.
Available formats:
2560 x 1920
TIFF
4 MB
320 x 240
PNG
375 KB
|
|
|
|
Sea surface temperature in the Gulf of Mexico and the Atlantic on 2007-09-01.
Available formats:
2560 x 1920
TIFF
4 MB
320 x 240
PNG
371 KB
|
|
|
|
Sea surface temperature in the Gulf of Mexico and the Atlantic on 2007-10-01.
Available formats:
2560 x 1920
TIFF
4 MB
320 x 240
PNG
368 KB
|
|

|
|
Sea surface temperature in the Gulf of Mexico and the Atlantic on 2007-11-01.
Available formats:
2560 x 1920
TIFF
4 MB
320 x 240
PNG
380 KB
|
|
|
|
Sea surface temperature in the Gulf of Mexico and the Atlantic on 2007-12-01.
Available formats:
2560 x 1920
TIFF
4 MB
320 x 240
PNG
377 KB
|
|
|
Back to Top
|

