La Nina 2007 Sea Surface Temperature Anomalies
|
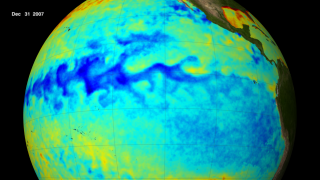
This visualization shows the 2007 La Nina event in the Pacific Ocean. Sea surface temperature (SST) anomalies from 2007 are shown based on a 3-day moving average using Aqua/AMSR-E SST data.
|
|
|
|
Sea surface temperature anomalies for the 2007 La Nina
Duration: 24.0 seconds
Available formats:
640x360 (30 fps)
MPEG-4
4 MB
1280x720 (30 fps)
MPEG-4
11 MB
512x288 (30 fps)
MPEG-1
8 MB
1280x720 (30 fps)
MPEG-2
42 MB
1280x720 (30 fps)
Frames
320x180
PNG
214 KB
160x80
PNG
52 KB
80x40
PNG
14 KB
How to play our movies
|
|
|
|
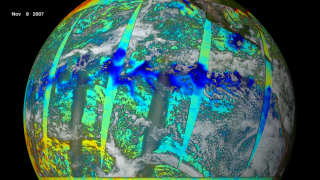
The cooler waters of a La Niña inhibit cloud growth overhead as seen in this Terra/MODIS mosaic from Nov. 8, 2007.
Available formats:
1280 x 720
TIFF
2 MB
320 x 180
PNG
248 KB
|
|
|
|
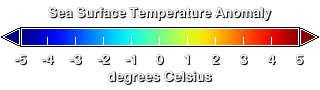
Sea surface temperature anomaly color bar in degrees Celcius: -5 (dark blue) to 0 (green), to +5 (dark red)
Available formats:
320 x 90
PNG
12 KB
|
|
|
Back to Top
|

