Skip all navigation and jump to content Jump to site navigation Jump to section navigation.
NASA Logo - Goddard Space Flight Center + Visit NASA.gov
HOME PROJECTS RESOURCES SEARCH MAP

+ Advanced Search
Home
Home
View Most Recently Released Imagery
View Gallery of Imagery: A topical collection of SVS Imagery
Search Imagery by the keywords assigned to it
Search Imagery by the instruments that supplied data for a visualization product
Search Imagery by the series of visualizations that have been produced
Search Imagery by the scientist providing the data used in a visualization product
Search Imagery by the animator that created the product
Search Imagery by the identification number assigned to the visualization product
See other search options
Learn about the SVS Image Server
  + About the Server
  + Animation List
  + How to Use the Server


  + RSS Feeds
blank image
Previous Animation
Next Animation
Minimum Sea Ice Comparison: 2005, 2007 and the 1979-2007 Average

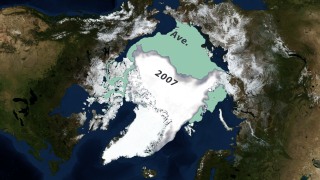
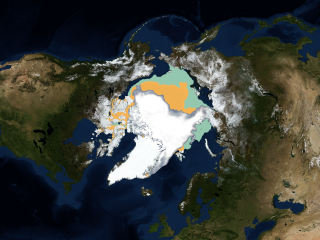
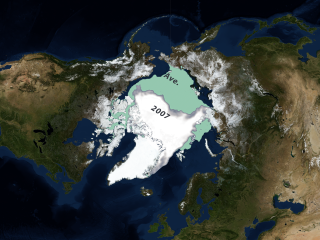
Sea ice is frozen seawater floating on the surface of the ocean. Some sea ice is semi-permanent, persisting from year to year, and some is seasonal, melting and refreezing from season to season. The sea ice cover reaches its minimum extent at the end of each summer and the remaining ice is called the perennial ice cover. The 2007 Arctic summer sea ice reached the lowest extent of perennial ice cover on record - nearly 25% less than the previous low set in 2005. The area of the perennial ice has been steadily decreasing since the satellite record began in 1979, at a rate of about 10% per decade. But the 2007 minimum, reached on September 14, is far below the previous record made in 2005 and is about 38% lower than the climatological average. Such a dramatic loss has implications for ecology, climate and industry.

A full global version of this animation was initially developed for a Science-on-a-Sphere exhibit. A smaller subset is shown here focusing on the Arctic region. The animation is shown on a plane with a geographic (lat/lon) projection, but has been rotated 90 degrees so that the Arctic is in the center of the image. The animation compares the difference between the perennial sea ice minimum extent on September 21, 2005 and September 14, 2007. Both years are compared with the 1979-2007 average minimum sea ice.


This animation compares the 2005 annual Arctic minimum sea ice from 09/21/2005 (shown in orange) with the 2007 minimum sea ice from 09/14/2007. The average minimum sea ice from 1979 through 2007 is shown in green.    This animation compares the 2005 annual Arctic minimum sea ice from 09/21/2005 (shown in orange) with the 2007 minimum sea ice from 09/14/2007. The average minimum sea ice from 1979 through 2007 is shown in green.
Duration: 22.0 seconds
Available formats:
  320x180     PNG           290 KB
  160x80       PNG           67 KB
  80x40         PNG           17 KB
  1280x720 (30 fps) Frames
  1280x720 (60 fps) Frames
  1920x1080 (30 fps) Frames
  1920x1080 (60 fps) Frames
  720x486 (30 fps) Frames
  720x486 (60 fps) Frames
  512x288 (30 fps) MPEG-1   3 MB
  1280x720 (30 fps) MPEG-2   14 MB
  640x360 (30 fps) MPEG-4   1 MB
  1280x720 (30 fps) MPEG-4   2 MB
How to play our movies


This image compares the 2007 annual Arctic minimum sea ice from 09/14/2007 with the 2005 minimum sea ice from 09/21/2005 (shown in orage). The average minimum sea ice from 1979 through 2007 is shown in green.    This image compares the 2007 annual Arctic minimum sea ice from 09/14/2007 with the 2005 minimum sea ice from 09/21/2005 (shown in orage). The average minimum sea ice from 1979 through 2007 is shown in green.

Available formats:
  2560 x 1920     TIFF 6 MB
  320 x 240         PNG 379 KB


This image shows the above comparison without labels.    This image shows the above comparison without labels.

Available formats:
  2560 x 1920     TIFF 6 MB
  320 x 240         PNG 386 KB


This image compares the 2007 annual Arctic minimum sea ice from 09/14/2007 with the average minimum sea ice from 1979 through 2007 (shown in green).    This image compares the 2007 annual Arctic minimum sea ice from 09/14/2007 with the average minimum sea ice from 1979 through 2007 (shown in green).

Available formats:
  2560 x 1920     TIFF 7 MB
  320 x 240         PNG 380 KB


This image shows the above comparison without labels.
   This image shows the above comparison without labels.

Available formats:
  2560 x 1920     TIFF 11 MB
  320 x 240         PNG 378 KB

Animation Number:3474
Animators:Cindy Starr (SVS) (Lead)
 Greg Shirah (SVS)
Completed:2007-10-23
Scientist:Josefino Comiso (NASA/GSFC)
Instruments:DMSP/SSMI
 Nimbus-7/SMMR
Data set:Comiso's September Minimum Sea Ice Concentration
Data Collected:2005-09-21, 2007-09-14, 1979-2007 Average
Keywords:
DLESE >> Cryology
SVS >> HDTV
GCMD >> EARTH SCIENCE >> Cryosphere
GCMD >> EARTH SCIENCE >> Cryosphere >> Sea Ice
GCMD >> EARTH SCIENCE >> Cryosphere >> Snow/Ice
GCMD >> EARTH SCIENCE >> Oceans >> Sea Ice
GCMD >> EARTH SCIENCE >> Cryosphere >> Sea Ice >> Ice Extent
GCMD >> EARTH SCIENCE >> Cryosphere >> Sea Ice >> Sea Ice Concentration
GCMD >> EARTH SCIENCE >> Cryosphere >> Snow/Ice >> Ice Extent
GCMD >> EARTH SCIENCE >> Hydrosphere >> Snow/Ice >> Ice Extent
GCMD >> EARTH SCIENCE >> Oceans >> Sea Ice >> Ice Extent
 
 
Please give credit for this item to
NASA/Goddard Space Flight Center Scientific Visualization Studio
The Blue Marble data is courtesy of Reto Stockli (NASA/GSFC).


Back to Top

USA.gov logo - the U.S. Government's official Web portal. + Privacy Policy and Important Notices
+ Reproduction Guidelines
NASA NASA Official:
SVS Contact:
Curator: