Skip all navigation and jump to content Jump to site navigation Jump to section navigation.
NASA Logo - Goddard Space Flight Center + Visit NASA.gov
HOME PROJECTS RESOURCES SEARCH MAP

+ Advanced Search
Home
Home
View Most Recently Released Imagery
View Gallery of Imagery: A topical collection of SVS Imagery
Search Imagery by the keywords assigned to it
Search Imagery by the instruments that supplied data for a visualization product
Search Imagery by the series of visualizations that have been produced
Search Imagery by the scientist providing the data used in a visualization product
Search Imagery by the animator that created the product
Search Imagery by the identification number assigned to the visualization product
See other search options
Learn about the SVS Image Server
  + About the Server
  + Animation List
  + How to Use the Server


  + RSS Feeds
blank image
Previous Animation
Next Animation
Comparison of Minimum Sea Ice between 2005 and 2007 - Full Screen

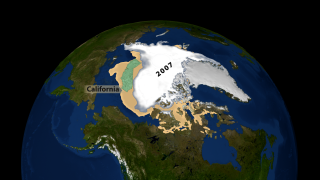
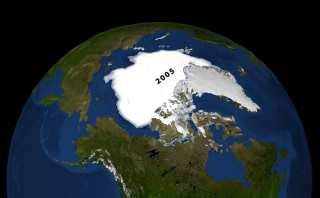
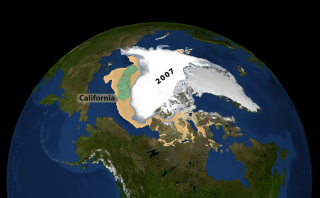
Sea ice is frozen seawater floating on the surface of the ocean. Some sea ice is semi-permanent, persisting from year to year, and some is seasonal, melting and refreezing from season to season. The 2007 Arctic summer sea ice has reached the lowest extent of perennial ice cover on record - nearly 25% less than the previous low set in 2005. The area of the perennial ice has been steadily decreasing since the satellite record began in 1979, at a rate of about 10% per decade. But the 2007 minimum, reached on September 14, is far below the previous record made in 2005 and is about 38% lower than the climatological average. Such a dramatic loss has implications for ecology, climate and industry.

In this animation, the 2005 sea ice minimum extent is initially shown over the Arctic. As the 2005 minimum sea ice fades to orange, the 2007 minimum extent comes into view. The state of California, shown in green, is placed in the melt region for a comparison of the size difference between the two years..


This animation shows a comparison between the 2005 and 2007 minimum sea ice extent.  The state of California, shown in green, is compared to the area of melted region.    This animation shows a comparison between the 2005 and 2007 minimum sea ice extent. The state of California, shown in green, is compared to the area of melted region.
Duration: 15.0 seconds
Available formats:
  320x180     PNG           173 KB
  160x80       PNG           44 KB
  80x40         PNG           11 KB
  1280x720 (30 fps) Frames (Composite)
  1280x720 (60 fps) Frames (Composite)
  512x288 (30 fps) MPEG-1   1 MB
  1280x720 (30 fps) MPEG-2   7 MB
  1280x720 (30 fps) MPEG-4   4 MB
  640x360 (30 fps) MPEG-4   1 MB
How to play our movies


This frame sequence contains the background sea ice without any text labels or the state of California.    This frame sequence contains the background sea ice without any text labels or the state of California.

Available formats:
  320x180     PNG           171 KB
  1280x720 (30 fps) Frames (Background)
  1280x720 (60 fps) Frames (Background)
How to play our movies


This frame sequence contains only the text overlays along with the state of California on a transparent background.    This frame sequence contains only the text overlays along with the state of California on a transparent background.

Available formats:
  320x180     PNG           5 KB
  1280x720 (30 fps) Frames (Overlay)
  1280x720 (60 fps) Frames (Overlay)
How to play our movies


This image shows the minimum see ice on September 21, 2005.    This image shows the minimum see ice on September 21, 2005.

Available formats:
  3480 x 2160     TIFF 13 MB
  320 x 198         PNG 212 KB


This image shows a comparison between the minimum sea ice from 2005, shown in orange, and the 2007 mimimum sea ice from September 14, shown in white.  An area the size of California, shown in green, is overlain on the melt region.    This image shows a comparison between the minimum sea ice from 2005, shown in orange, and the 2007 mimimum sea ice from September 14, shown in white. An area the size of California, shown in green, is overlain on the melt region.

Available formats:
  3480 x 2160     TIFF 13 MB
  320 x 198         PNG 217 KB

Animation Number:3469
Animators:Cindy Starr (SVS) (Lead)
 Greg Shirah (SVS)
Completed:2007-09-27
Scientist:Josefino Comiso (NASA/GSFC)
Instrument:DMSP/SSMI
Data set:Comiso's September Minimum Sea Ice Concentration
Data Collected:2005-09-21 and 2007-09-14
Keywords:
DLESE >> Cryology
SVS >> HDTV
GCMD >> EARTH SCIENCE >> Cryosphere
GCMD >> EARTH SCIENCE >> Cryosphere >> Sea Ice
GCMD >> EARTH SCIENCE >> Cryosphere >> Snow/Ice
GCMD >> EARTH SCIENCE >> Hydrosphere >> Snow/Ice
GCMD >> EARTH SCIENCE >> Oceans >> Sea Ice
GCMD >> EARTH SCIENCE >> Cryosphere >> Sea Ice >> Ice Extent
GCMD >> EARTH SCIENCE >> Cryosphere >> Sea Ice >> Ice Growth/Melt
GCMD >> EARTH SCIENCE >> Cryosphere >> Sea Ice >> Sea Ice Concentration
GCMD >> EARTH SCIENCE >> Cryosphere >> Snow/Ice >> Ice Extent
GCMD >> EARTH SCIENCE >> Cryosphere >> Snow/Ice >> Ice Growth/Melt
GCMD >> EARTH SCIENCE >> Hydrosphere >> Snow/Ice >> Ice Extent
GCMD >> EARTH SCIENCE >> Oceans >> Sea Ice >> Ice Extent
SVS >> iPod
 
 
Please give credit for this item to
NASA/Goddard Space Flight Center Scientific Visualization Studio
The Next Generation Blue Marble data is courtesy of Reto Stockli (NASA/GSFC).


Back to Top

USA.gov logo - the U.S. Government's official Web portal. + Privacy Policy and Important Notices
+ Reproduction Guidelines
NASA NASA Official:
SVS Contact:
Curator: