Global TRMM Rainmap 2004
|
This is a three-hour global rainmap from January 1, 2005 through December 31, 2004, as compiled by the TRMM satellite's Multi-satellite Precipation Analysis. The TRMM Multi-satellite Precipitation Analysis produces three hourly rain rates at 0.250 latitude by 0.250 longitude grid covering 500S to 500N. The input data for this merged product include a merged intercalibrated microwave-only product (3B40RT) and an Infrared rain product that is calibrated using microwave rain rates (3B41RT). Currently, 3B40RT is generated using rain rate estimates from microwave measurements from the TRMM sensors and the Special Sensor Microwave Imagers on board the DMSP satellites using the Goddard Profiling Algorithm (GPROF). 3B41RT is based on infrared measurements from geostationary satellites that are calibrated using microwave rain estimates. The 3B42RT estimate consists of the merged microwave estimate within the 3 hourly 0.25 degree space/time grid when available, and the calibrated IR rain rates otherwise.
|
|
|
|
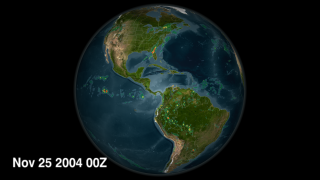
This animation is a slow rotation of the Earth with new global rainfall displayed every three hours for 2004.
Duration: 6.4 minutes
Available formats:
1280x720 (29.97 fps)
MPEG-4
44 MB
512x288 (30 fps)
MPEG-1
51 MB
1280x720 (60 fps)
Frames
3840x2160
TIFF
4 MB
320x180
PNG
132 KB
How to play our movies
|
|
|
|
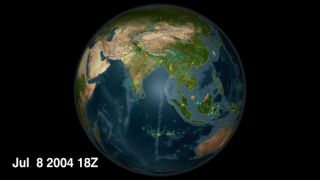
Nearly 30 million people have been affected by extensive flooding in the north-eastern states of India. This animation shows the torrential rains from July 5, 2005 through July 12, 2005.
Duration: 8.0 seconds
Available formats:
512x288 (30 fps)
MPEG-1
1 MB
1280x720 (9 fps)
Frames
320x180
PNG
132 KB
1280x720 (29.97 fps)
MPEG-4
1 MB
How to play our movies
|
|
|
|
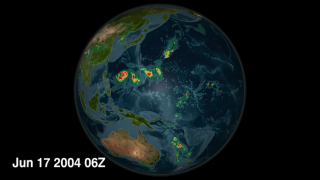
Typhoon Dianmu (Helen) intensified from a 70 kt/80 mph typhoon to a 155 kt/180 mph super typhoon on June 17, 2004. It is one of only nine typhoons since 1990 to reach that intensity.
Available formats:
3840 x 2160
TIFF
4 MB
320 x 180
PNG
133 KB
160 x 80
PNG
34 KB
80 x 40
PNG
9 KB
|
|
|
|
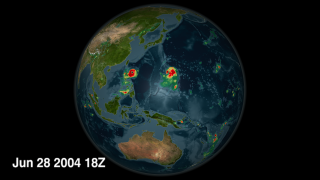
Typhoon Tingting and Typhoon Mindulle (Igme) both threatened the Asian Pacific Rim on June 28, 2004. Typhoon Tingting at 90 mph is on the right and Typhoon Mindulle at 145 mph is on the left.
Available formats:
3840 x 2160
TIFF
4 MB
320 x 180
PNG
133 KB
|
|

|
|
Colorbar
Available formats:
320 x 90
PNG
13 KB
|
|
|
Back to Top
|

