Skip all navigation and jump to content Jump to site navigation Jump to section navigation.
NASA Logo - Goddard Space Flight Center + Visit NASA.gov
HOME PROJECTS RESOURCES SEARCH MAP

+ Advanced Search
Home
Home
View Most Recently Released Imagery
View Gallery of Imagery: A topical collection of SVS Imagery
Search Imagery by the keywords assigned to it
Search Imagery by the instruments that supplied data for a visualization product
Search Imagery by the series of visualizations that have been produced
Search Imagery by the scientist providing the data used in a visualization product
Search Imagery by the animator that created the product
Search Imagery by the identification number assigned to the visualization product
See other search options
Learn about the SVS Image Server
  + About the Server
  + Animation List
  + How to Use the Server


  + RSS Feeds
blank image
Previous Animation
Next Animation
Simulations of the Gamma-Ray Sky

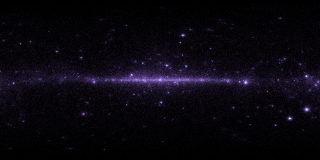
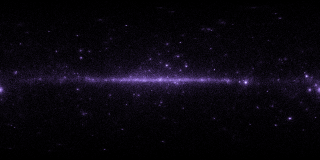
The Gamma-Ray Large Area Space Telescope (GLAST) will observe the sky in gamma-rays with energies between 10 million electron volts (MeV) to 300 billion electron volts (GeV) (a photon of visible light is roughly 2 electron volts). At these energies, the detectors will receive roughly 2 photons every second. At these energies, the objects visible will be active galaxies, quasars, pulsars, and gamma-ray bursts. This visualization is generated from one year of simulated photon event-lists using known sources. These event lists are used for testing the various data analysis software being developed for the project. Due to the extremely low event rate, it takes about one week of event accumulation to see structure in the sky. To generate the 600+ frames of this visualization, the event lists were box-car averaged for a duration of one week for each frame, and each frame shifted 50,000 seconds in time from the previous frame. The low angular resolution of gamma-ray detectors makes point sources appear spread out in the sky. In these maps, the color of each pixel represents the number of photons accumulated in that pixel (over an energy range of 10MeV-300GeV). Horizontally, across the center of the map, is the diffuse emission from the plane of our own Milky Way galaxy. The images are projected in galactic coordinates with a plate carrée projection so there is significant distortion with increasing latitude above the galactic disk. This emission in the galactic plane is created by pulsars and supernova remnants. Located away from this plane is emission from active galaxies and high-velocity pulsars. Occasionally, a bright spot appears which can be a gamma-ray burst or quasar in an active state.

A simulation movie of the high-energy gamma-ray sky as it might appear over the course of a year.   This is the slower version.    A simulation movie of the high-energy gamma-ray sky as it might appear over the course of a year. This is the slower version.
Duration: 41.0 seconds
Available formats:
  1280x720 (30 fps) MPEG-4   136 MB
  1920x1080 (30 fps) MPEG-4   296 MB
  2880x1440 (30 fps) Frames
  320x160     PNG           111 KB
  160x80       PNG           59 KB
  80x40         PNG           15 KB
  1280x720 (29.97 fps) QUICKTIME 733 MB
How to play our movies


A simulation movie of the high-energy gamma-ray sky as it might appear over the course of a year.   This is the faster version.    A simulation movie of the high-energy gamma-ray sky as it might appear over the course of a year. This is the faster version.
Duration: 10.0 seconds
Available formats:
  320x160     PNG           111 KB
  1280x720 (30 fps) QUICKTIME 312 MB
  1280x720 (29.97 fps) MPEG-4   8 MB
How to play our movies


A frame from the movie.  Notice that some sources visible in the first frame are no longer visible and some new sources have appeared.    A frame from the movie. Notice that some sources visible in the first frame are no longer visible and some new sources have appeared.

Available formats:
  2880 x 1440     TIFF 11 MB
  320 x 160         PNG 111 KB
  160 x 80           PNG 41 KB
  80 x 40             PNG 13 KB

Animation Number:3439
Animator:Tom Bridgman (SVS) (Lead)
Completed:2007-07-19
Scientists:Steven Ritz (NASA/GSFC)
 Julie McEnery (NASA/GSFC)
Instrument:GLAST/LAT
Data Collected:Simulation
Series:GLAST Pre-Launch
Goddard TV Tape:G2007-011HD -- GLAST Pre-Launch Resource Tape
Keywords:
SVS >> Gamma Ray
SVS >> HDTV
SVS >> Supernovae
SVS >> Black Hole
SVS >> Active Galaxy
SVS >> Quasar
SVS >> Gamma Ray Burst
SVS >> Astrophysics
SVS >> Sky Map
SVS >> GLAST
 
 
Please give credit for this item to
NASA/Goddard Space Flight Center Scientific Visualization Studio


Back to Top

USA.gov logo - the U.S. Government's official Web portal. + Privacy Policy and Important Notices
+ Reproduction Guidelines
NASA NASA Official:
SVS Contact:
Curator: