TRMM Microwave Measurements during Hurricane Katrina: Vertical Polarization
|
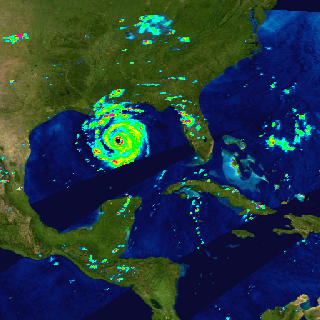
The TMI instrument on the TRMM satellite measures microwaves emitted from the Earth's land and water. By comparing emission from different microwave frequencies, the characteristics of ice and water in the atmosphere can be determined. For example, 85 GHz microwaves are scattered by ice crystals in tropical cyclones, making cyclone rain bands appear 'colder' than the surrounding areas. By comparing 85 GHz temperatures in different polarizations with other frequency band measurements, accurate measurements of rainfall in the atmosphere can be made. This animation shows eight days of global TMI 85 GHz measurements in the Gulf of Mexico during Hurricane Katrina. The hurricane Katrina rainbands clearly show up in these images.
|
|
|
|
Vertically polarized 85GHz microwave brightness temperatures measured by the TMI instrument on TRMM from August 22, 2005 through August 30, 2005, during Hurricane Katrina.
Duration: 8.0 seconds
Available formats:
512x512 (29.97 fps)
MPEG-1
2 MB
320x320
PNG
158 KB
160x80
PNG
23 KB
80x40
PNG
6 KB
512x512
Frames
How to play our movies
|
|
This product is available through our Web Map Service.
Click here to learn more.
|
|
|
|
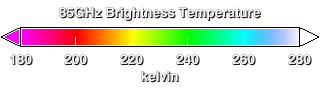
Color bar for the brightness temperature.
Available formats:
320 x 90
PNG
975 B
|
|
|
Back to Top
|


