Hurricane Katrina Sea Surface Temperature (WMS)
|
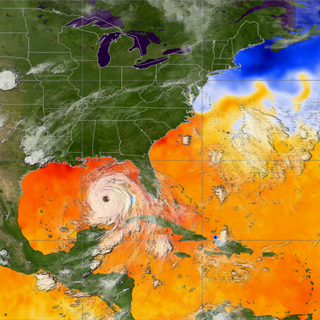
This visualization shows the cold water trail left by Hurricane Katrina. The data is from August 23 through 30, 2005. The colors on the ocean represent the sea surface temperatures, and satellite images of the hurricane clouds are laid over the temperatures to clearly show the hurricane positions. Orange and red depict regions that are 82 degrees F and higher, where the ocean is warm enough for hurricanes to form. Hurricane winds are sustained by the heat energy of the ocean, so the ocean is cooled as the hurricane passes and the energy is extracted to power the winds. The sea surface temperatures are 3-day moving averages based on the AMSR-E instrument on the Aqua satellite, while the cloud images were taken by the Imager on the GOES-12 satellite.
|
|
|
|
GOES-12 infrared imagery over AMSR-E sea surface temperature for Hurricane Katrina, from August 23, 2005 to August 30, 2005.
Duration: 9.0 seconds
Available formats:
512x512 (29.97 fps)
MPEG-1
2 MB
320x320
PNG
204 KB
160x80
PNG
26 KB
80x40
PNG
7 KB
1024x1024
Frames
How to play our movies
|
|
This product is available through our Web Map Service.
Click here to learn more.
|
|
|
|
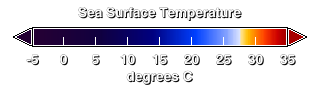
The legend for sea surface temperature.
Available formats:
320 x 90
PNG
9 KB
|
|
|
Back to Top
|


