Skip all navigation and jump to content Jump to site navigation Jump to section navigation.
NASA Logo - Goddard Space Flight Center + Visit NASA.gov
HOME PROJECTS RESOURCES SEARCH MAP

+ Advanced Search
Home
Home
View Most Recently Released Imagery
View Gallery of Imagery: A topical collection of SVS Imagery
Search Imagery by the keywords assigned to it
Search Imagery by the instruments that supplied data for a visualization product
Search Imagery by the series of visualizations that have been produced
Search Imagery by the scientist providing the data used in a visualization product
Search Imagery by the animator that created the product
Search Imagery by the identification number assigned to the visualization product
See other search options
Learn about the SVS Image Server
  + About the Server
  + Animation List
  + How to Use the Server


  + RSS Feeds
blank image
Previous Animation
Next Animation
Global Surface Wind Speed during Hurricane Frances (WMS)

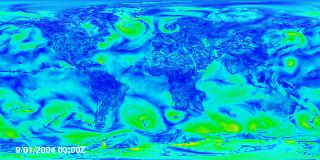
The weight of the Earth's atmosphere exerts pressure on the surface of the Earth. This pressure varies from place-to-place and from time-to-time due to surface irregularities, uneven heating of the atmosphere by the sun, and the Earth's rotation. Differences in pressure from place-to-place cause winds to try to flow from high pressure to low pressure regions to even out the differences, but the Earth's rotation and wind friction with the surface act to slow or divert the winds. This animation shows the surface wind speeds for the whole globe from September 1, 2004, through September 5, 2004, during the period of Hurricane Frances in the western Atlantic Ocean and Typhoon Songda in the western Pacific Ocean. The highest, smoothest winds occur over the oceans where there are no surface irregularities to break up the flow, while flows over land tend to be irregular and highly variable. The highest winds occur in Hurricane Frances and Typhoon Songda, but note that the hurricane's wind speeds reduce dramatically when crossing Florida.

Global surface wind speed from the 0.25 degree resolution fvGCM atmospheric model for the period 9/1/2005 through 9/5/2005.    Global surface wind speed from the 0.25 degree resolution fvGCM atmospheric model for the period 9/1/2005 through 9/5/2005.
Duration: 20.0 seconds
Available formats:
  160x80       PNG           28 KB
  80x40         PNG           7 KB
  320x160     JPEG         16 KB
  1000x721   Frames
  640x320 (29.97 fps) MPEG-1   5 MB
How to play our movies

This product is available through our Web Map Service.   Click here to learn more.


Legend for the surface wind speed.
   Legend for the surface wind speed.

Available formats:
  320 x 90           PNG     956 B

Animation Number:3201
Animator:Horace Mitchell (SVS) (Lead)
Completed:2005-07-25
Scientist:William Putman (NASA/GSFC)
Data set:fvGCM
Data Collected:2005-09-01T03:00 -- 2005-09-05T24:00
Series:WMS
 fvGCM
Keywords:
DLESE >> Atmospheric science
DLESE >> Natural hazards
GCMD >> EARTH SCIENCE >> Atmosphere >> Atmospheric Phenomena >> Hurricanes
GCMD >> EARTH SCIENCE >> Atmosphere >> Atmospheric Phenomena >> Typhoons
GCMD >> EARTH SCIENCE >> Atmosphere >> Atmospheric Winds >> Surface Winds
GCMD >> EARTH SCIENCE >> Human Dimensions >> Natural Hazards >> Meteorological Hazards
GCMD >> Location >> Global
SVS >> Hurricane Frances
View Animation in Google Earth Google Earth KML file is available here.
DEPC Metadata is available here.
 
 
Please give credit for this item to
NASA/Goddard Space Flight Center Scientific Visualization Studio


Back to Top

USA.gov logo - the U.S. Government's official Web portal. + Privacy Policy and Important Notices
+ Reproduction Guidelines
NASA NASA Official:
SVS Contact:
Curator: